Classification
Smoothness Index
For position prediction in virtual environments, jitter or noise in the output signal is not wanted though often present.
Since discovering smooth areas is a similar problem to jitter detection, a simple method for determining jitter can be used to measure non-jitter, smoothness (Joppich, Rausch and Kuhlen, 2013).
It is assumed that jitter-free areas of a position signal do not differ in velocity.
Smooth areas do not differ in intensity, and therefore only low changes in velocity (intensity change) can be recorded.
For the reduction of noise, this operation is performed on the smoothed input image.
Then the smoothness $s$ of a pixel $p$ in its k-neighbourhood $\mathcal{N}_k$ can be determined as:
\begin{equation}
s(p) = \sum\limits_{p' \in \mathcal{N}_k} \nabla(p') / \arg\max\limits_{p} s(p)
\end{equation}
Using thresholding, $TS_l \leq s(p) \leq TS_u \wedge TI_l \leq I \leq TI_u$, different areas, such as background or pathogen, can be selected.
For the empirical choice of thresholds, it can be argued that these are tailored to the specific case.
While this surely is true to a certain extent, the here presented method has been successfully tested on images from a completely different domain, and no changes to the thresholds have been made to make it work.
A proper theoretical evaluation is emphasized, however, is probably not the aim of the iGEM competition.
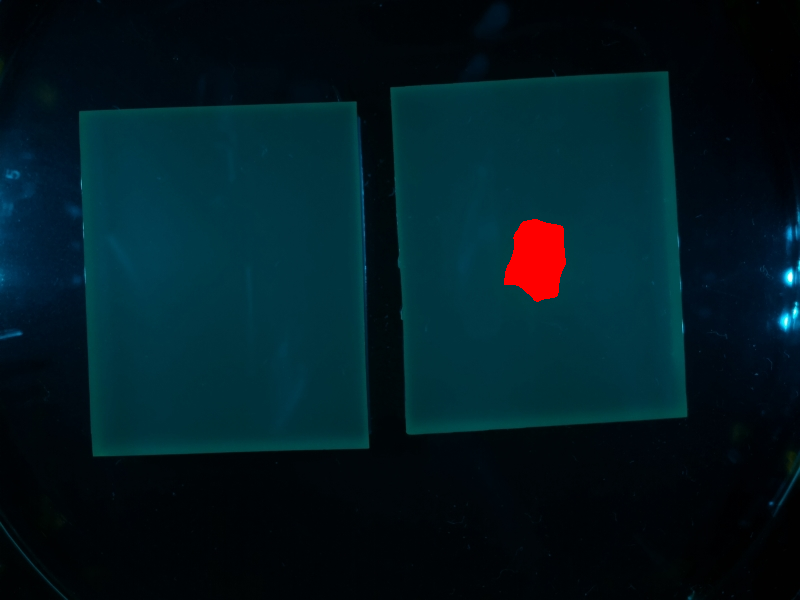
Finally, selecting for the red region, this delivers the location of possible pathogens.
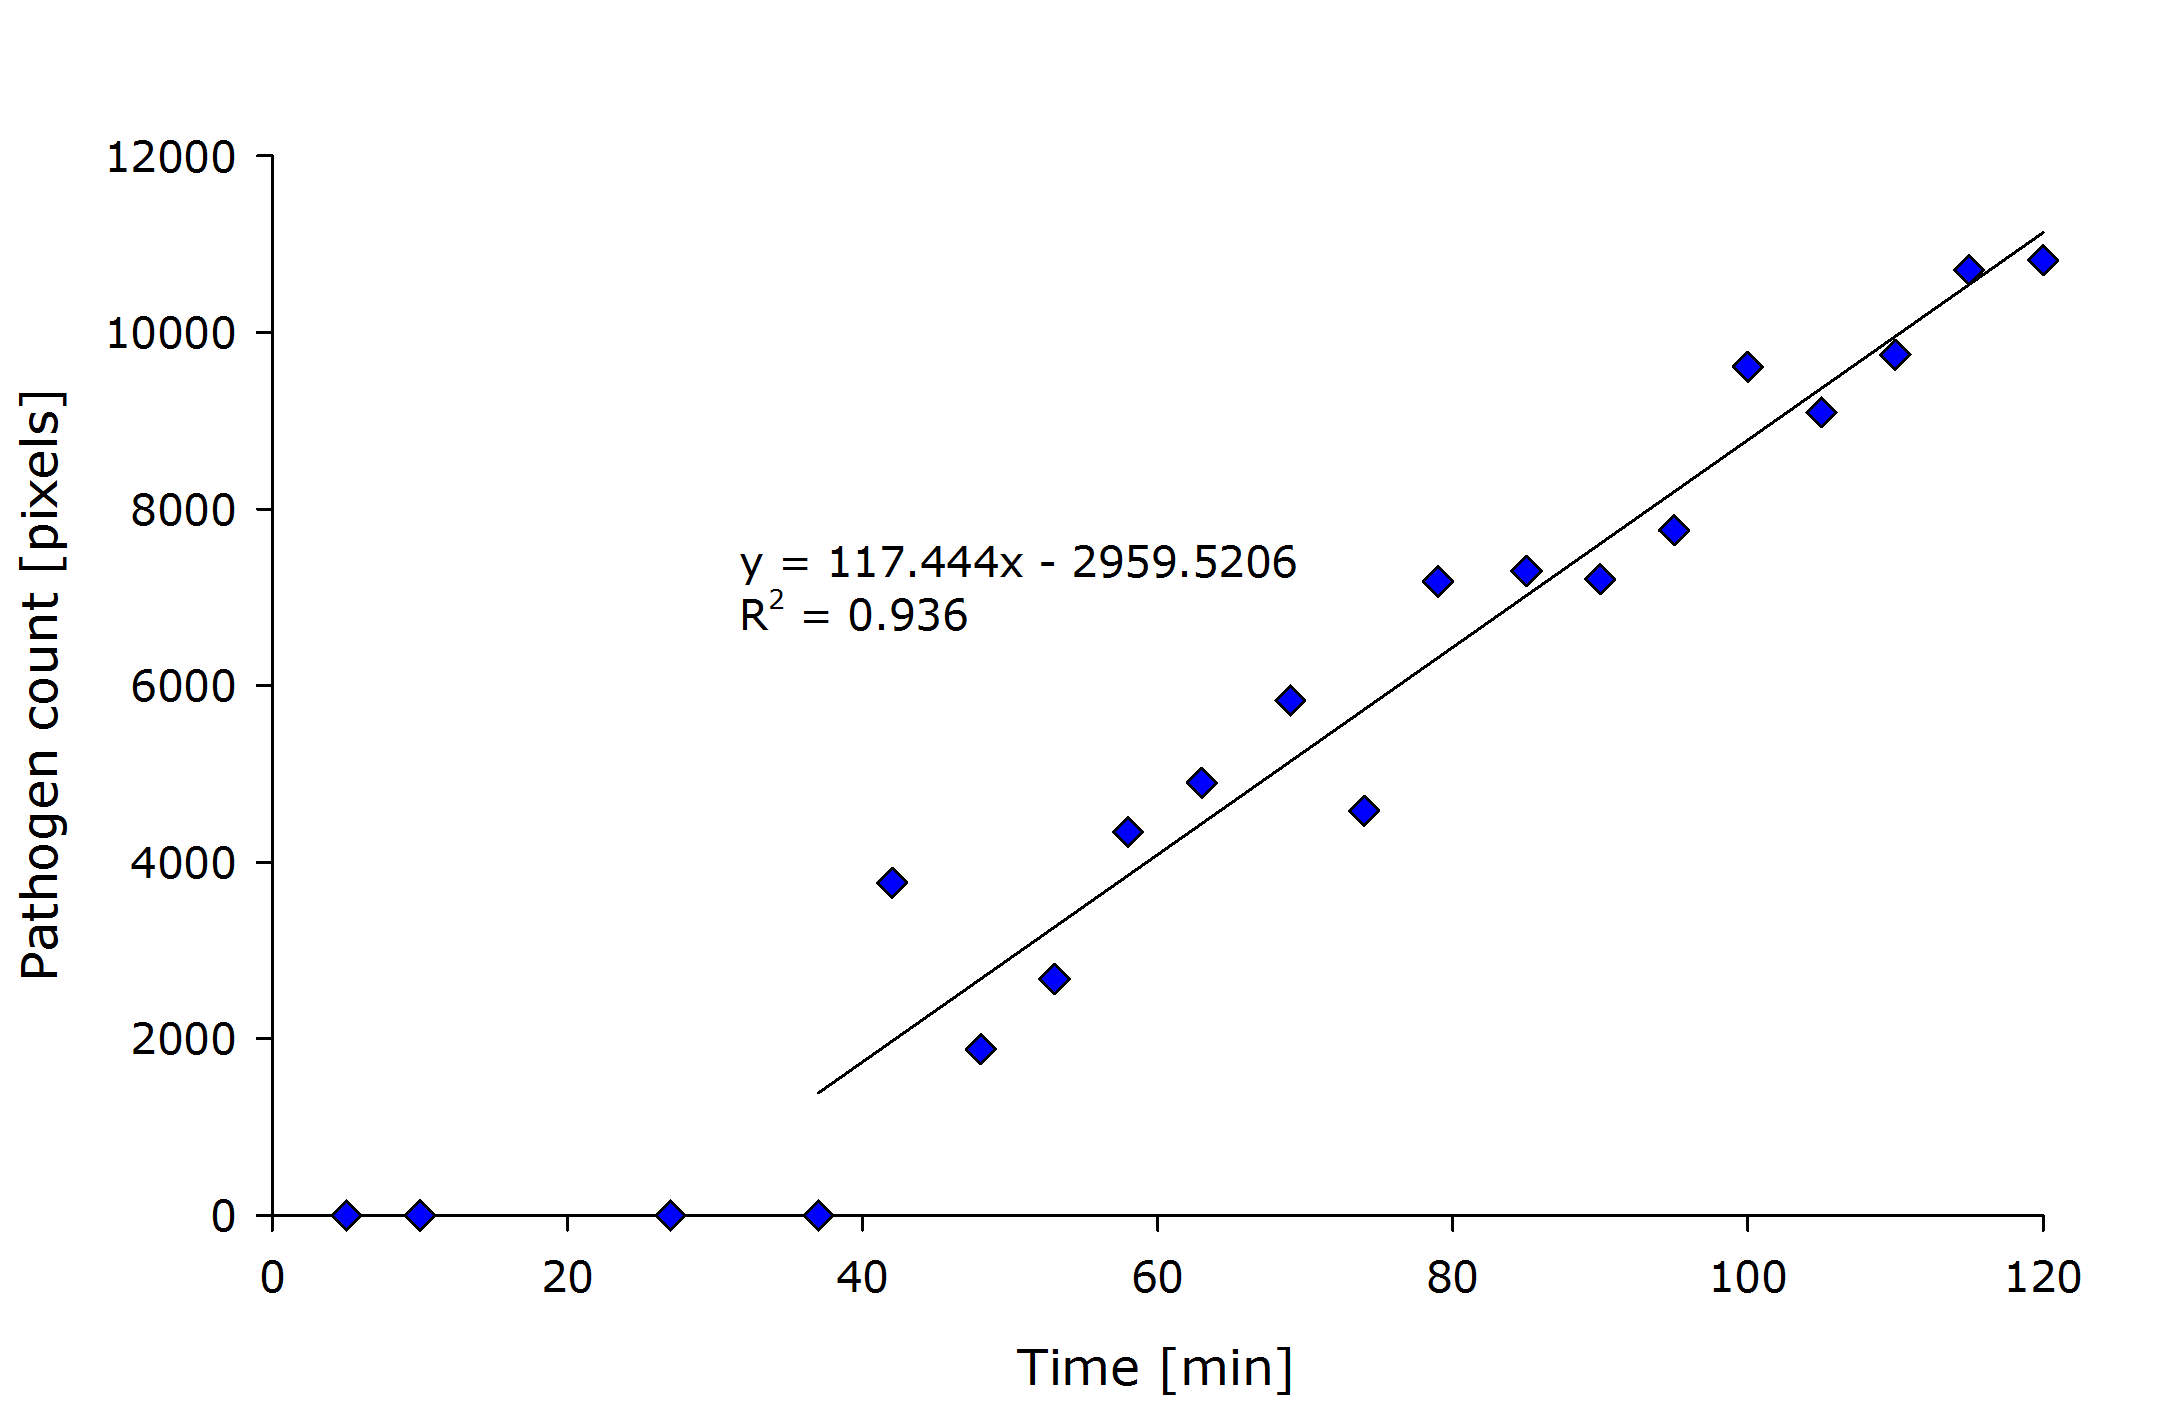
Since the size of the agar chips is variable but fixed a quantitative analysis can be performed by counting pixels for instance.
Empirical Evaluation
Using our MATLAB code we found the lower threshold for the smoothness index to be $TS_l = 0.85$ and the upper threshold $TS_u = \infty$.
Similarly, for $TI_l = 235$ and $TI_u = \infty$.
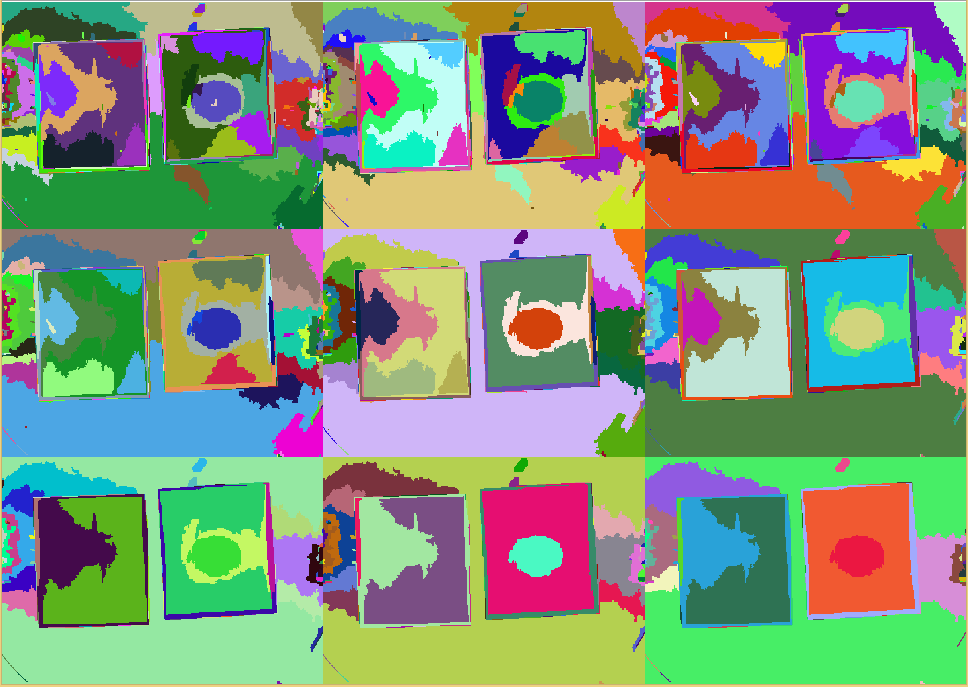
Using these settings, we can find a response already in images taken after 42 minutes.
Ideally, one would rate the quality of the image segmentation using some ground truth, such as manual delineations. This still has to be done for our method.
However, from visual observations, our method is showing promising results.
- image of smoothness index
Automatic Classification
function [mask, seg] = automaticseeds(im)

    imc = im;

    %% to grayscale and filtering
    Z = double(rgb2gray(im));
    Z = 255 * Z / max(max(Z));

    filtertype = 'disk';
    Z = filter2(fspecial(filtertype), Z);
    Z = filter2(fspecial(filtertype), filter2(fspecial(filtertype), Z));
    Z = 255 * Z / max(max(Z));

    %% calculating similarity score/smoothness index
    k=4;
    sSI = similarity(Z,k);
    sSI = sSI / max(max(sSI));

    %% classify
    pathogene = ((sSI > 0.85) == 1) & ((Z > 235) == 1);

    mask = ones( size(imc) );
    seg = zeros( size(imc) );


    %% output
    for i=1:size(im,1)
        for j=1:size(im,2)

            if (pathogene(i,j) == 1)
                seg(i,j,1:3) = [255 0 0];
                mask(i, j, 1:3) = [0 0 0];
            end
        end
    end
end
This code actually creates two intermediate images from which the similarity index is calculated.
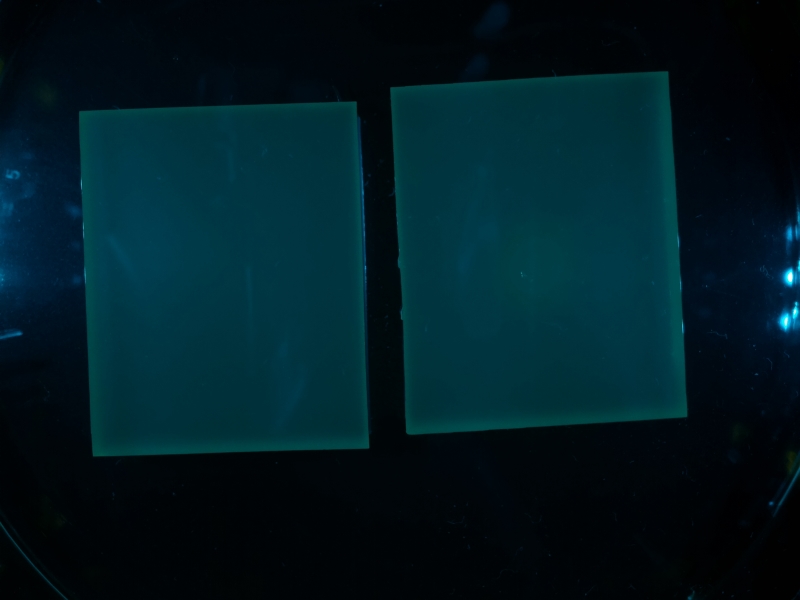
First the smoothed (disk-filter) input image is created and stored:
Only white regions are candidate regions.
After smoothing, the similarity index is calculated. As expected, edges are detected and limit the area from which the target region can be selected.
Finally the selected pathogen region is selected by the black area in the following picture:
Combined with the input image, the final segmentation is received:
|
 "
"
