Team:ETH Zurich/expresults/qs/tab-plux
From 2014.igem.org
(Difference between revisions)
| Line 1: | Line 1: | ||
{|class="wikitable" style="background-color: white; text-align:center; width:auto; margin: auto;" | {|class="wikitable" style="background-color: white; text-align:center; width:auto; margin: auto;" | ||
|+'''Table 1''' Crosstalk matrix for the promoter plux ([http://parts.igem.org/Part:BBa_R0062:Experience BBa_R0062]) | |+'''Table 1''' Crosstalk matrix for the promoter plux ([http://parts.igem.org/Part:BBa_R0062:Experience BBa_R0062]) | ||
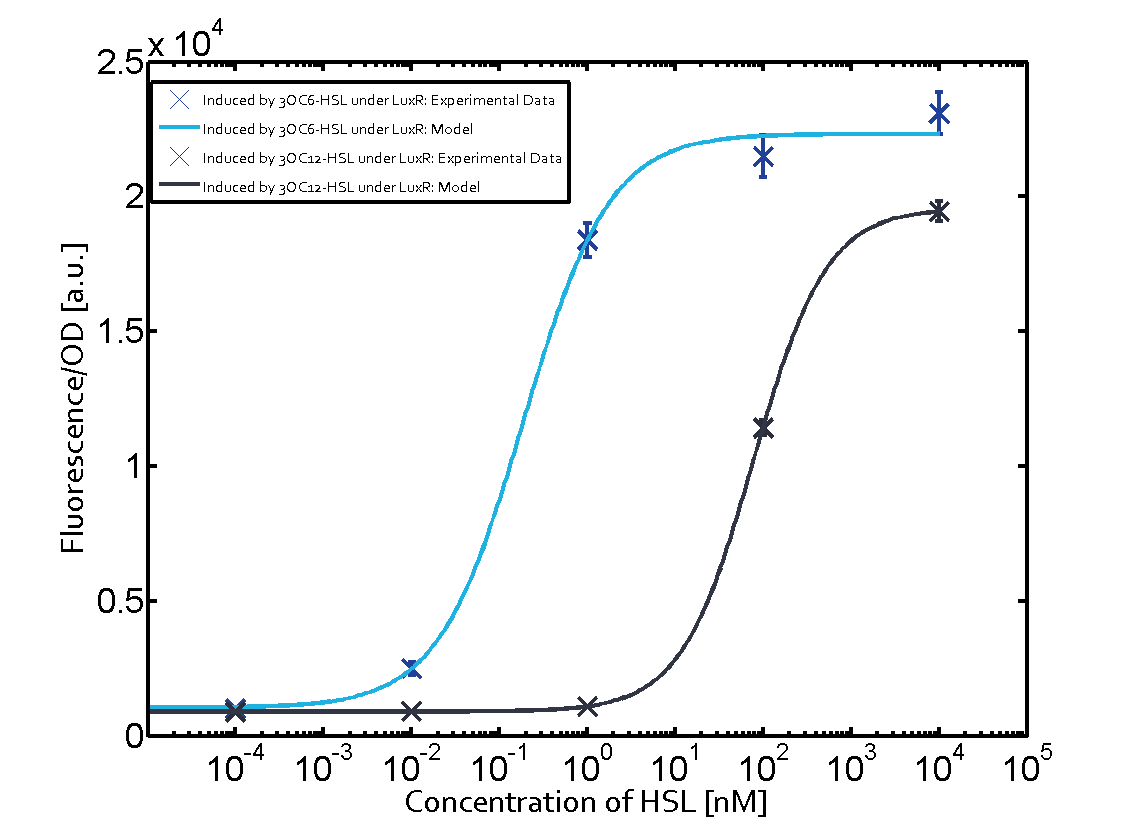
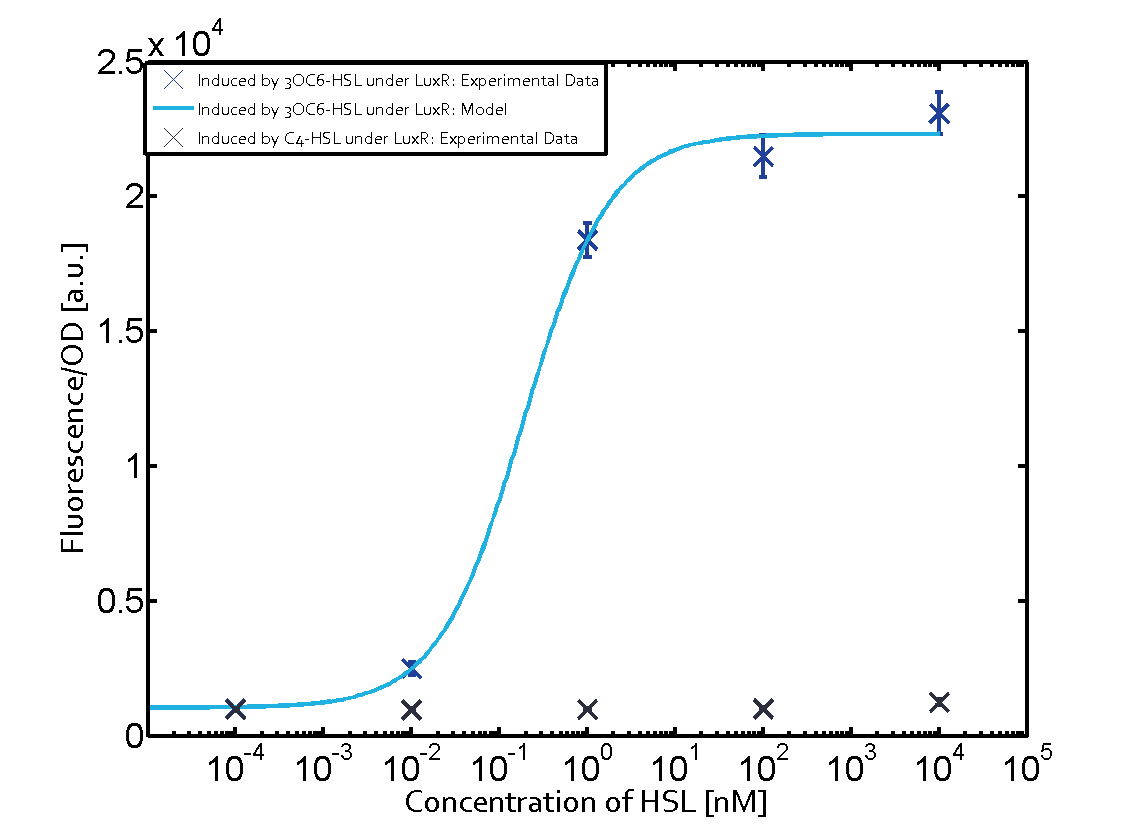
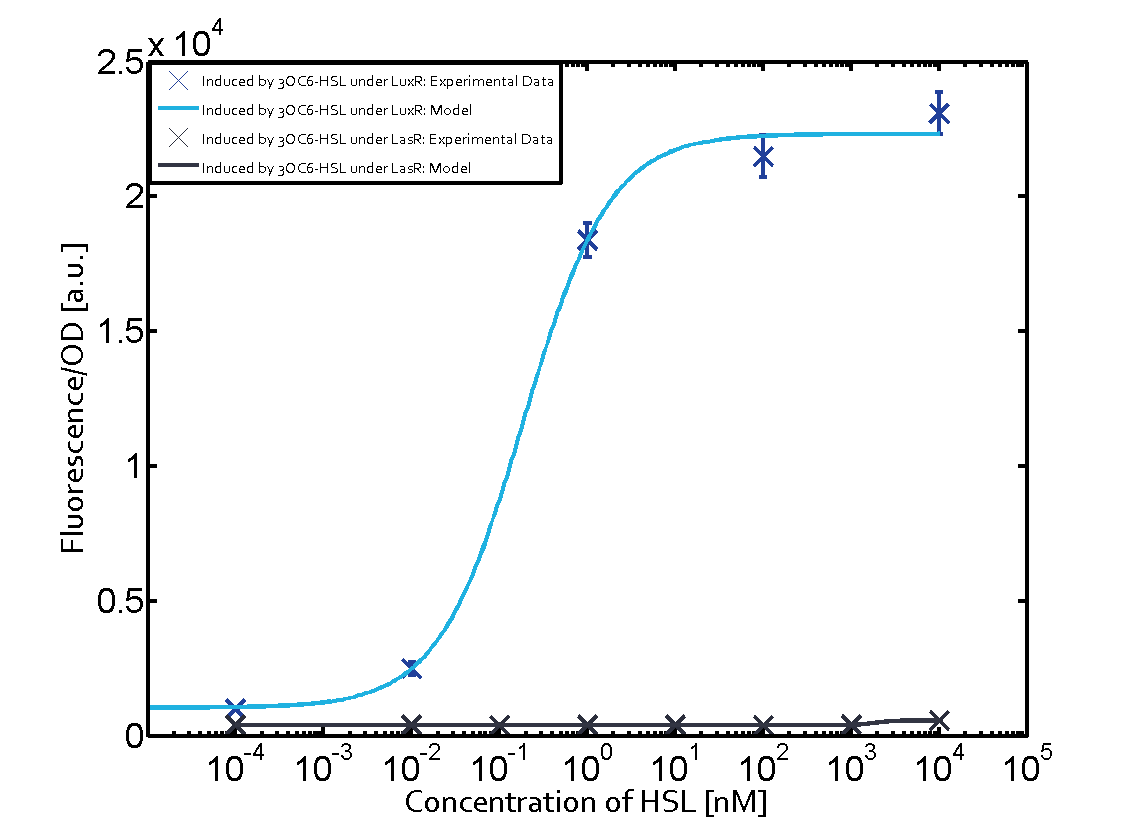
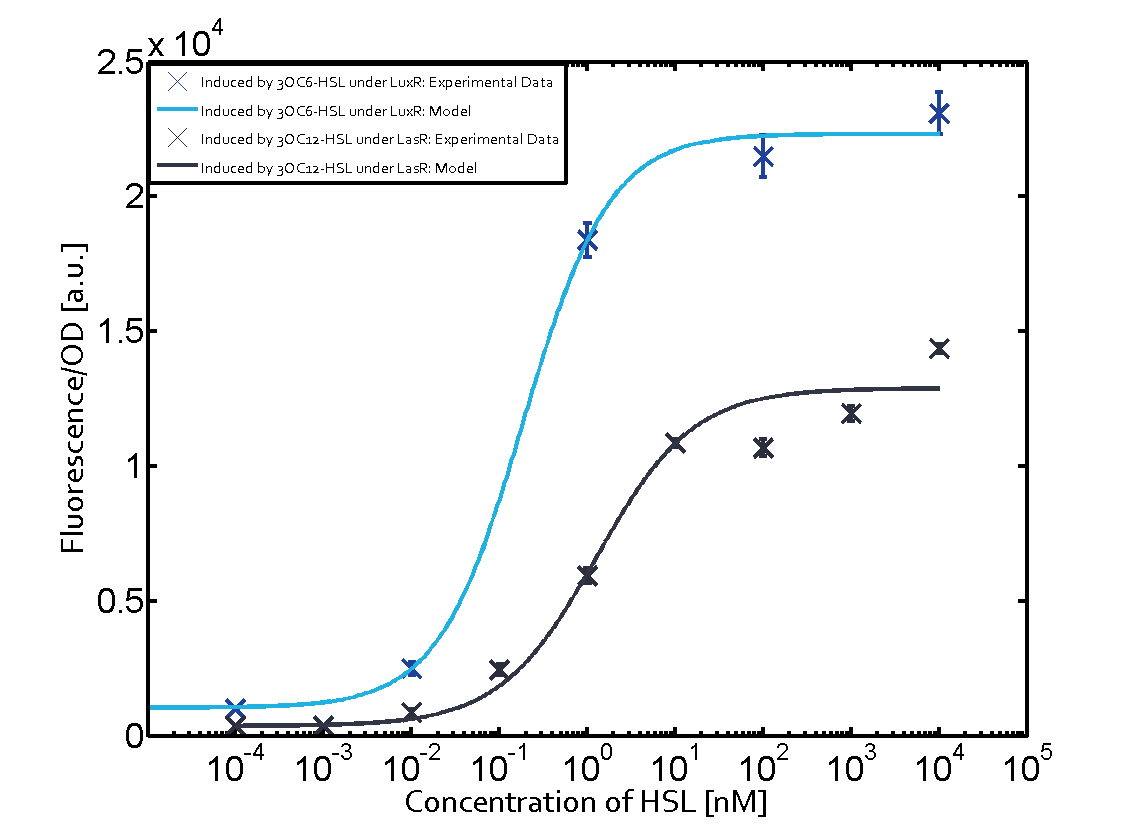
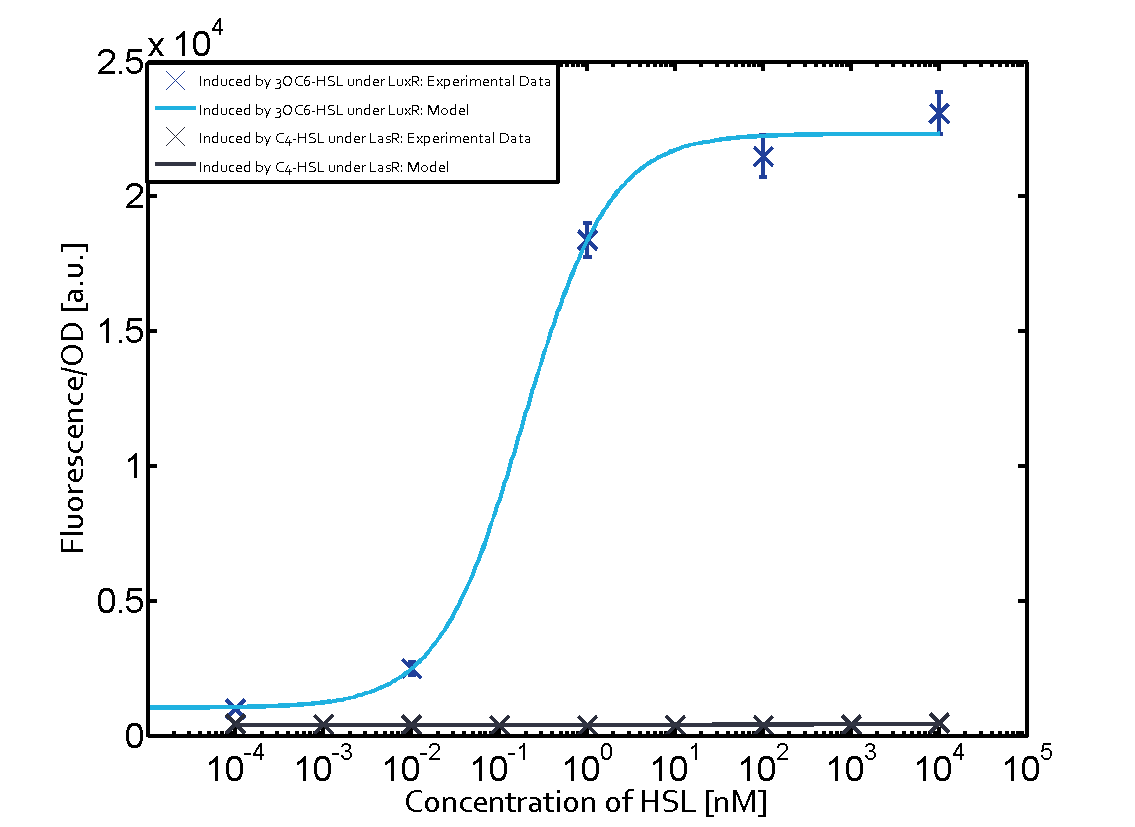
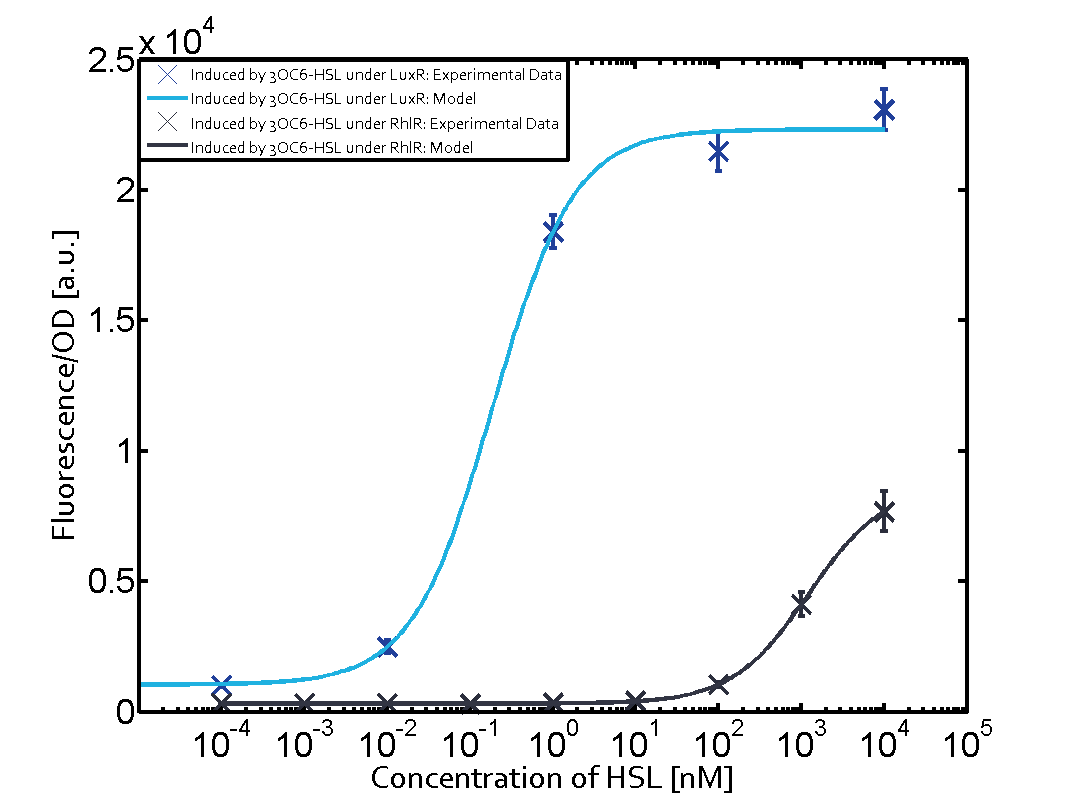
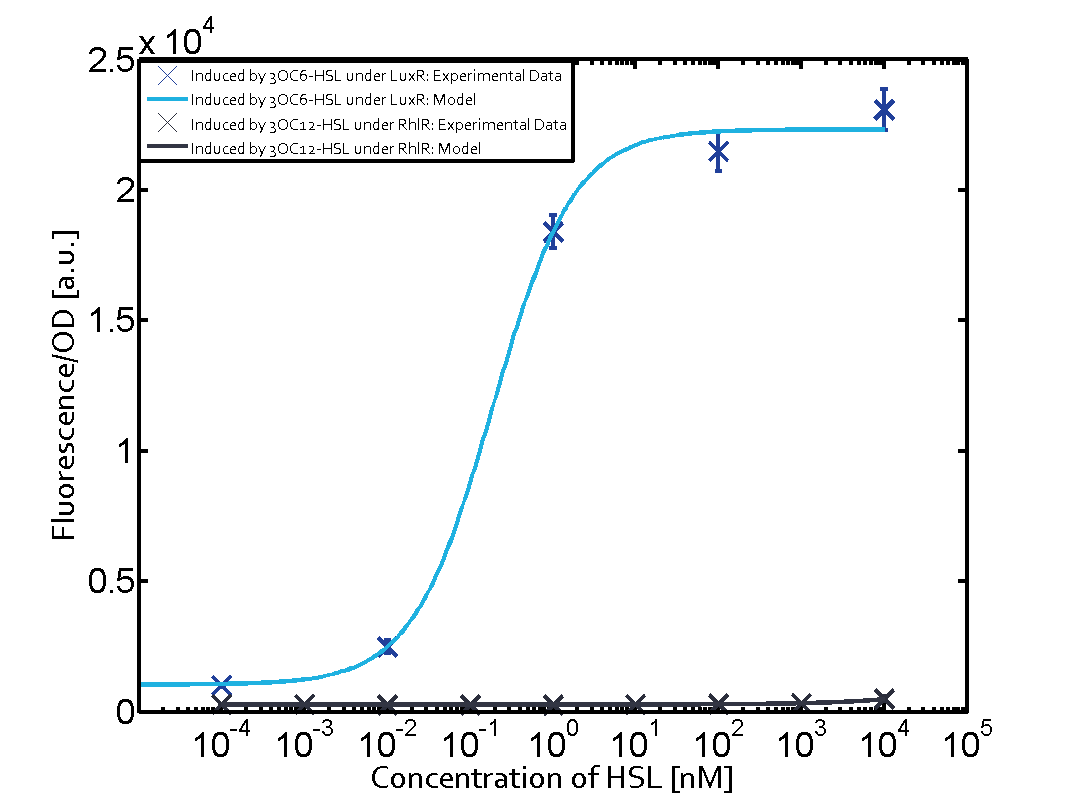
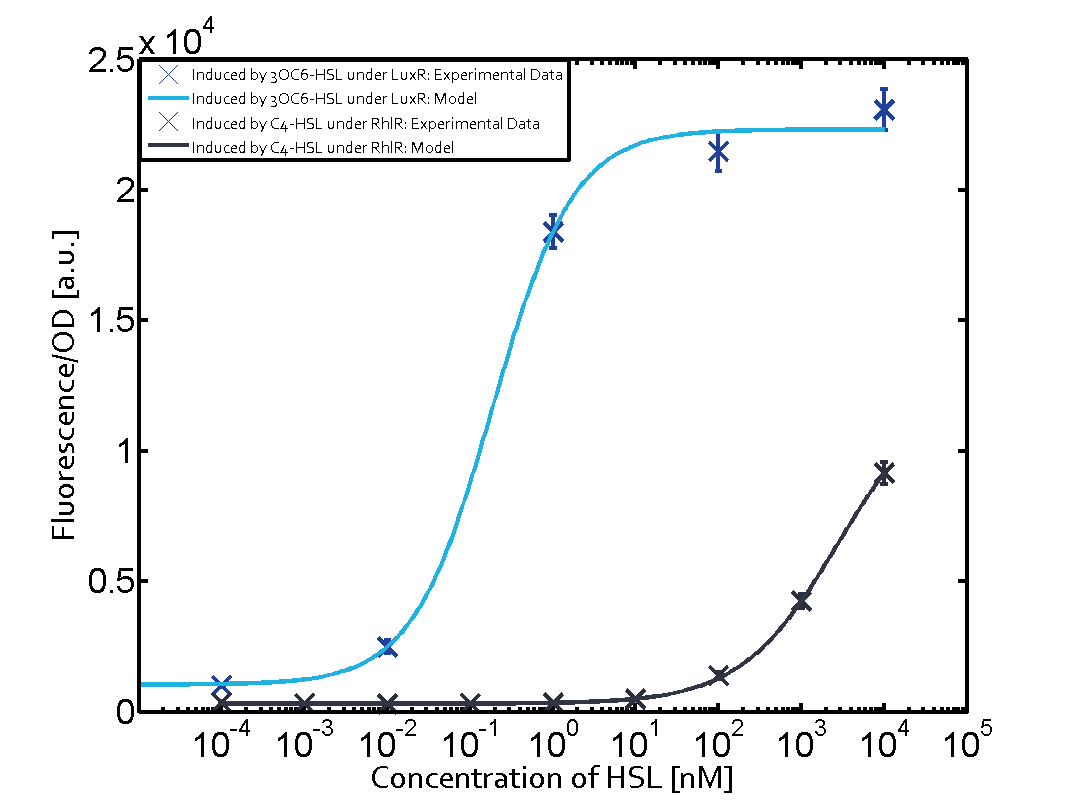
| - | + | In all the measurements conducted to create this matrix the promoter pLux was the basis and was induced in six different variations shown. | |
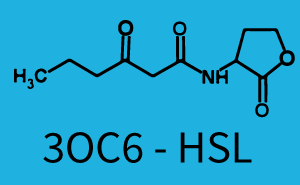
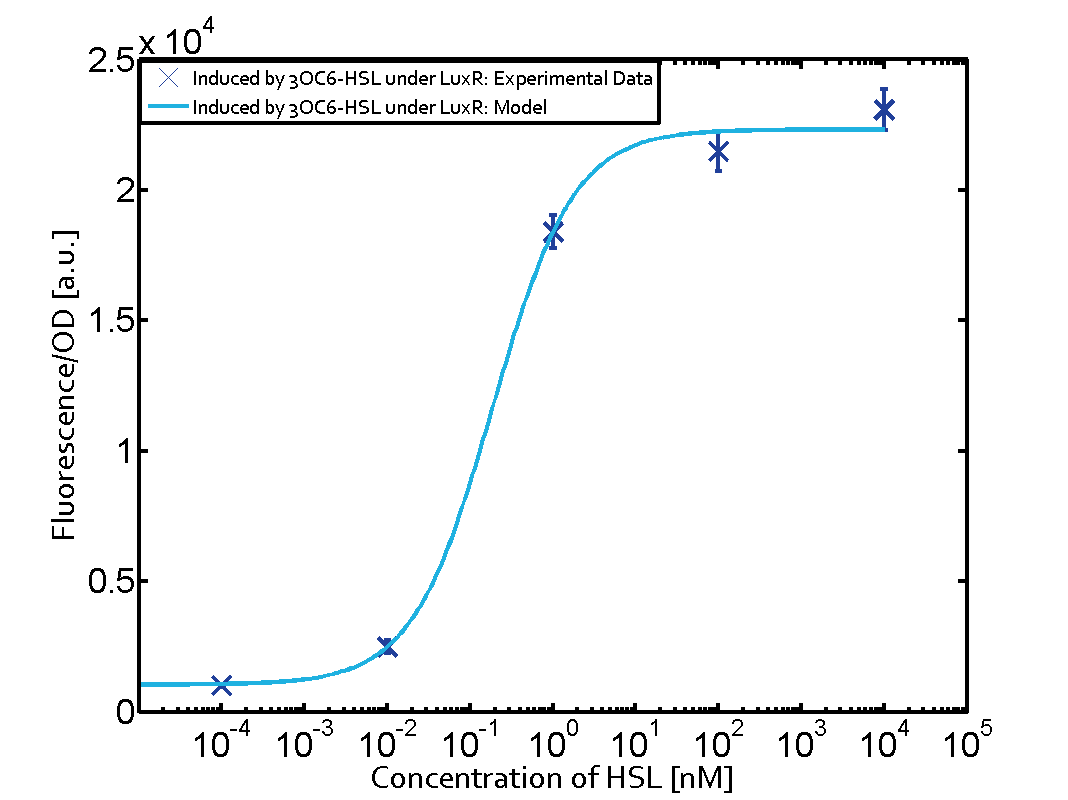
The dark blue points in the graph top left show the activation of gene expression when pLux is induced by 3OC6-HSL (Lux-AHL) binding to the corresponding LuxR regulator. The observed transition occurs at a concentration of approximately 1 nM 3OC6-HSL. The light-blue curve plotted shows modeling data of pLux induced by 3OC6-HSL (Lux-AHL) binding to the corresponding LuxR regulator. This curve from the model and the dark blue data point gained in experiments were plotted as a reference in all the other graphs describing pLux. | The dark blue points in the graph top left show the activation of gene expression when pLux is induced by 3OC6-HSL (Lux-AHL) binding to the corresponding LuxR regulator. The observed transition occurs at a concentration of approximately 1 nM 3OC6-HSL. The light-blue curve plotted shows modeling data of pLux induced by 3OC6-HSL (Lux-AHL) binding to the corresponding LuxR regulator. This curve from the model and the dark blue data point gained in experiments were plotted as a reference in all the other graphs describing pLux. | ||
 "
"

