Team:NCTU Formosa/results
From 2014.igem.org
(→Magic Power of Our Pyramidal Device) |
(→PBAN Gene Synthesis ( Full Gene Design Process )) |
||
| Line 20: | Line 20: | ||
===PBAN Biobricks Test=== | ===PBAN Biobricks Test=== | ||
====PBAN Gene Synthesis ( Full Gene Design Process )==== | ====PBAN Gene Synthesis ( Full Gene Design Process )==== | ||
| - | <p>For our project (aim for capturing harmful insects) this year, we first found 9 different kinds of PBAN peptide of common agricultural harmful insects in the world from many reference papers. Then, we used these peptides to surf the NCBI and found the DNA sequence from the certain insect. ( | + | <p>For our project (aim for capturing harmful insects) this year, we first found 9 different kinds of PBAN peptide of common agricultural harmful insects in the world from many reference papers. Then, we used these peptides to surf the NCBI and found the DNA sequence from the certain insect. ( EX: PBAN Spodoptera litura:'''http://www.ncbi.nlm.nih.gov/protein/AAK84160.1''' ) Finally, we modified every codon on the DNA sequence and designed the DNA sequence for our ''E.coli'' to express a certain PBAN. </p> |
<p>DNA Modification Process: </p> | <p>DNA Modification Process: </p> | ||
<p>1. Avoid the rare codon of ''E.coli'', and choosing high frequency codons. <br> | <p>1. Avoid the rare codon of ''E.coli'', and choosing high frequency codons. <br> | ||
| Line 30: | Line 30: | ||
<p>Take PBAN Spodoptera litura for example:</p> | <p>Take PBAN Spodoptera litura for example:</p> | ||
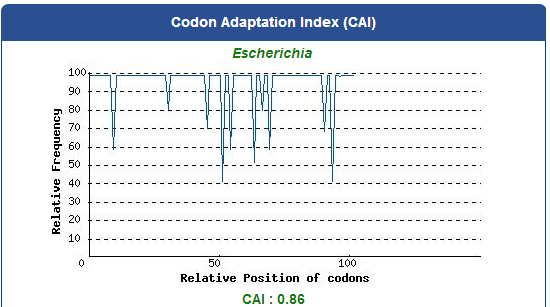
| - | [[File:PBAN_Spodoptera_litura_CAI_Value.png|thumb|center|1200px| | + | [[File:PBAN_Spodoptera_litura_CAI_Value.png|thumb|center|1200px| Fig.2-1-1 The distribution of codon usage frequency along the length of your CDS to be expressed in your target host organism. Possibility of high protein expression level is correlated to the value of CAI - a CAI of 1.0 is considered to be ideal while a CAI of >0.8 is rated as good for expression in the desired expression organism. GenScript's OptimumGeneTM codon optimization tool can typically improve your sequence to reach a CAI of higher than 0.8 thus better chance of high level protein expression.]] |
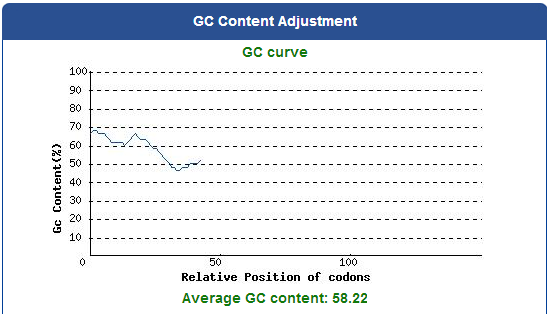
| - | [[File:Average_GC_content.png|thumb|center|1200px| | + | [[File:Average_GC_content.png|thumb|center|1200px| Fig.2-1-2 The ideal percentage range of GC content is between 30% to 70%. Any peaks outside of this range will adversely affect transcriptional and translational efficiency.]] |
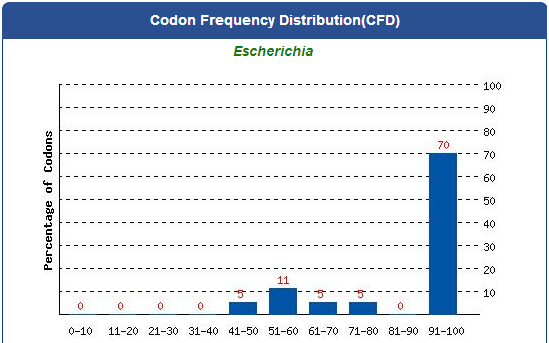
| - | [[File:Codon_Frequency_Distribution.png|thumb|center|1200px| | + | [[File:Codon_Frequency_Distribution.png|thumb|center|1200px| Fig.2-1-3 The percentage distribution of codons in computed codon quality groups. The value of 100 is set for the codon with the highest usage frequency for a given amino acid in the desired expression organism. Codons with values lower than 30 are likely to hamper the expression efficiency.]] |
<p>5. Add iGEM standard sequence in front of and at the back of our modified DNA sequence.</p> | <p>5. Add iGEM standard sequence in front of and at the back of our modified DNA sequence.</p> | ||
<p>6. Let the gene synthesis company synthesize our modified DNA sequence.</p> | <p>6. Let the gene synthesis company synthesize our modified DNA sequence.</p> | ||
Revision as of 15:29, 15 October 2014
Contents |
Magic Power of Our Pyramidal Device
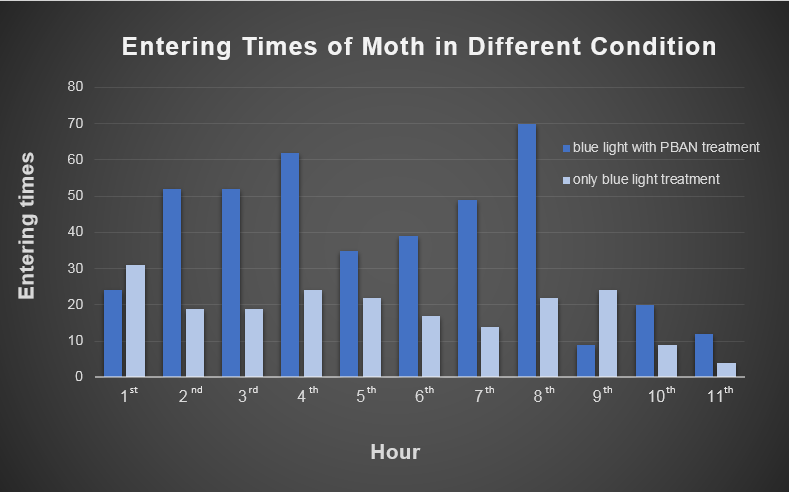
Our device combines blue light and PBAN to achieve powerful and specific insect attraction. We did a long-time observation to record the entering number (into our device) per hour below. In Fig. 2-0, we can really see our device's powerful!
Our experiment can roughly divided into two categories.
1. About PBAN Biobricks Test:gene recombination and protein expression.
2. About Insect Tests:PBAN effect test, insects' habbit test and our device test.
PBAN Biobricks Test
PBAN Gene Synthesis ( Full Gene Design Process )
For our project (aim for capturing harmful insects) this year, we first found 9 different kinds of PBAN peptide of common agricultural harmful insects in the world from many reference papers. Then, we used these peptides to surf the NCBI and found the DNA sequence from the certain insect. ( EX: PBAN Spodoptera litura:http://www.ncbi.nlm.nih.gov/protein/AAK84160.1 ) Finally, we modified every codon on the DNA sequence and designed the DNA sequence for our E.coli to express a certain PBAN.
DNA Modification Process:
1. Avoid the rare codon of E.coli, and choosing high frequency codons.
( Frequence Table Tool:http://www.genscript.com/cgi-bin/tools/codon_freq_table )
2. Don't choose the same codon to modify our designed gene many times, or our E.coli will not have enough nucleotides to replicate it.
3. Avoid the start codon ATG existing in the front of our DNA sequence.
4. Use Rare Codon Analysis Tool ( http://www.genscript.com/cgi-bin/tools/rare_codon_analysis ) to inspect if there is any problem to express our gene for E.coli.
Take PBAN Spodoptera litura for example:
5. Add iGEM standard sequence in front of and at the back of our modified DNA sequence.
6. Let the gene synthesis company synthesize our modified DNA sequence.
PBAN PCR Result

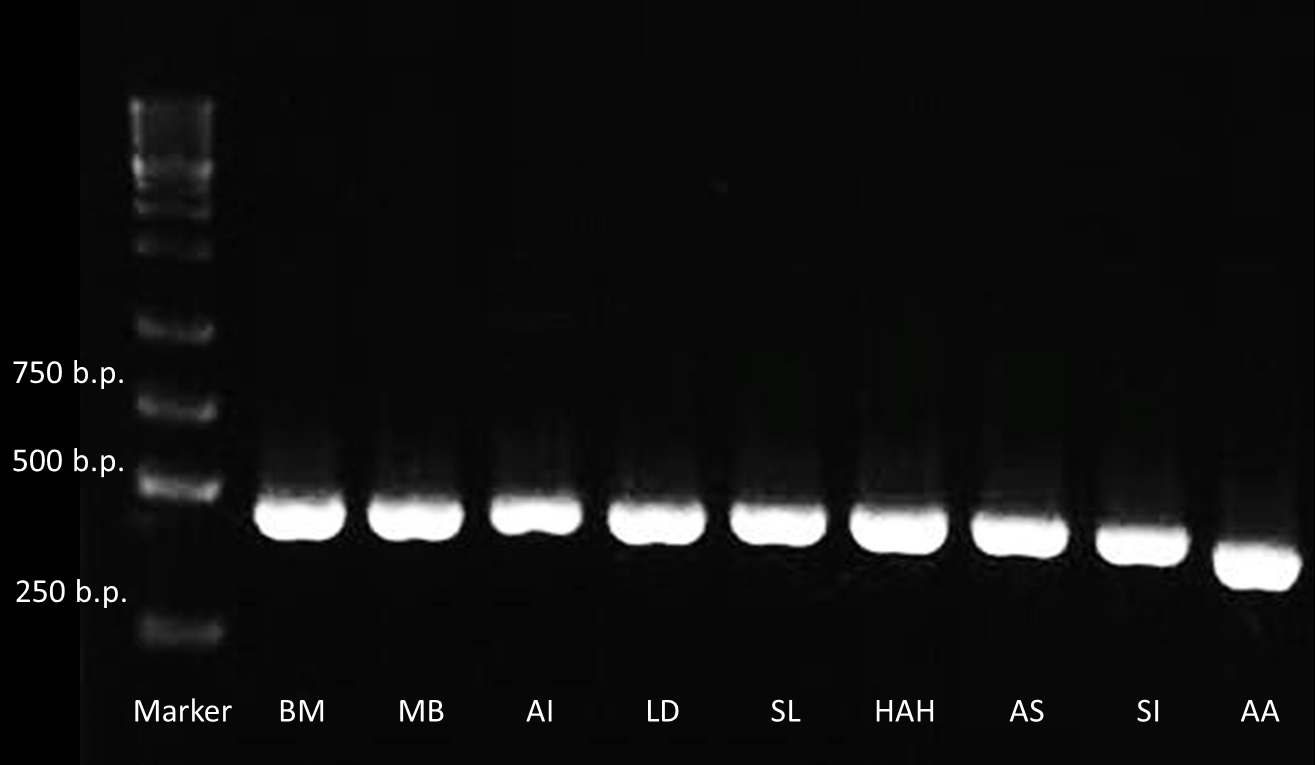
For checking the size of the DNA sequence getted from the gene synthesis company, we recombined each PBAN gene to PSB1C3 backbone and do PCR ro check each PBAN size.
Because our PBAN DNA sequence length is around 100~150 bp. The PCR result should be 415~515 bp. The fig.2-1-3 shows the correct size of our PBAN, and proves we succeed in ligating our PBAN gene to the ideal backbone.
PBAN Peptide SDS Protein Electrophoresis
In advance, for proving all the 9 different kinds of PBAN can be produced by our E.coli, we smashed the E.coli, containing our PBAN with Sonicator and take the supernatant divided from the bacterial pellet after centrifuged to do 20% gel SDS protein electrophoresis.
Because PBAN peptide is an around 30 amino acids substance, in fig.2-1-5 we can see the band at 2~4kDa, and the E.coli containg Pcons+RBS Plasmid don't. This result proves that our E.coli can really produce our PBAN.
Blue Light Fluorescence / Bacteria Growth Test

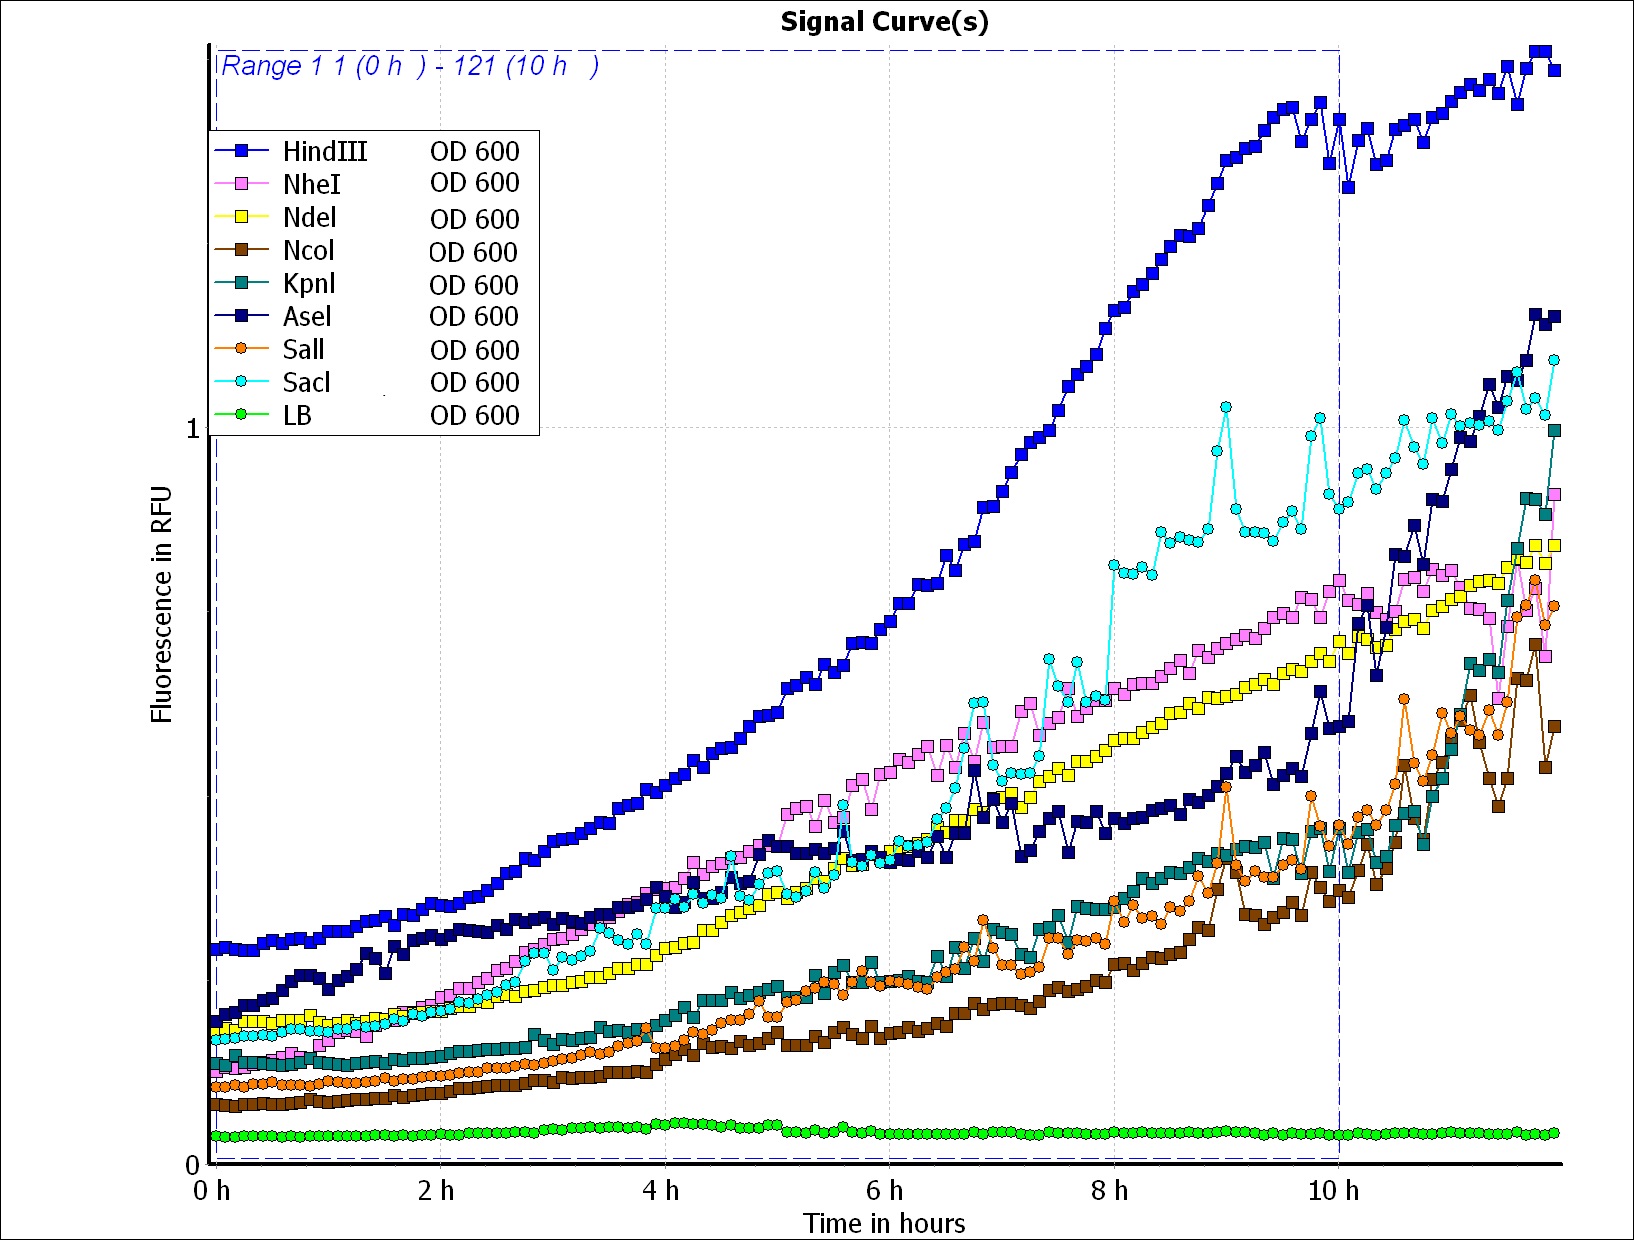
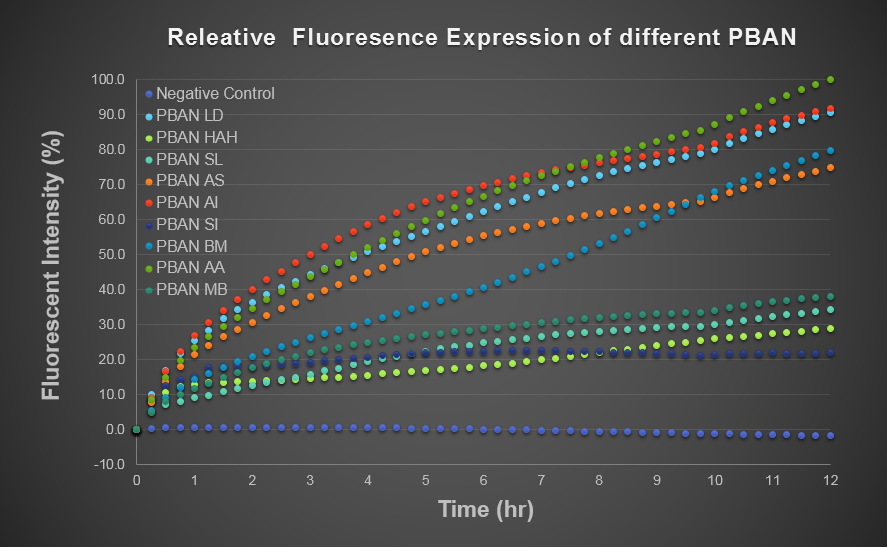
We wanted to use computer modeling to help us predicting PBAN expression in E.coli, so we decided to use blue light flourescence to reach our goal. Our thought is that we can compute the average value of the blue light flourescence expression value of the biobrick part (above) and of the Pcons + RBS + BFP + Ter and regard the average value as the prediction of our PBAN expression in E.coli ( Pcons + RBS + PBAN + Ter ) ( More detail can be seen in our Modeling Page. ) This is the blue light flourescence expression curve and bacterial growth curve (OD 600) below in long time, we use these data to predict our PBAN expression in E.coli.
Process to Get PBAN from Our E.coli.
For getting PBAN from our E.coli., we first cultivated our E.coli. containing Pcons + RBS + One Kind of PBAN plasmid in 12 hrs. Then, we smashed our E.coli. with sonicator and centrifuged the solution to let our PBAN divided into the supernatant. Finally, we take the supernatant to autoclave to avoid biosafety problem. ( Because PBAN is a very simple and short peptide, we think our PBAN will not be degraded after the autoclave treatment. ) This is all the process that we get PBAN from our E.coli..Insect Tests
Behavior of Target Insects After PBAN Treatment
To realize what kind of behavior female moth would show after eating PBAN and releasing pheromone, we put one or several female moths into a beaker which was divided into two layers and the lower layer contained PBAN solution made by ourselves, and then we sealed the beaker with handi-wrap, the toilet paper which was soaked with PBAN solution connected the both layers of the beaker helped female moth suck PBAN solution, we started filming as soon as we observed that the female moth show obvious behavior, the moth sample included Spodoptera litura, Mamestra brassicae, Helicoverpa armigera Hubner which we caught in Sunny Morning organic farm.
We think as long as the target female moth eats our PBAN, tons of PBAN can be absorbed in the moth's body in high posibility and thus, our PBAN can stimulate the moth's pheromone gland to produce pheromone and make our moth ruts. As soon as the moth is in rut, it will flap its wings rapidly and move its tail upward slightly. Thus, before the PBAN effect testing, we decided to observe the behavior of our target female moth eating our PBAN and we hoped to see the expected behavior result.
These movie showed after two different kinds of female moths eats our PBAN SL & PBAN MB, these two moths really became excited and all flapped their wings rapidly.
Powerful Effect of PBAN
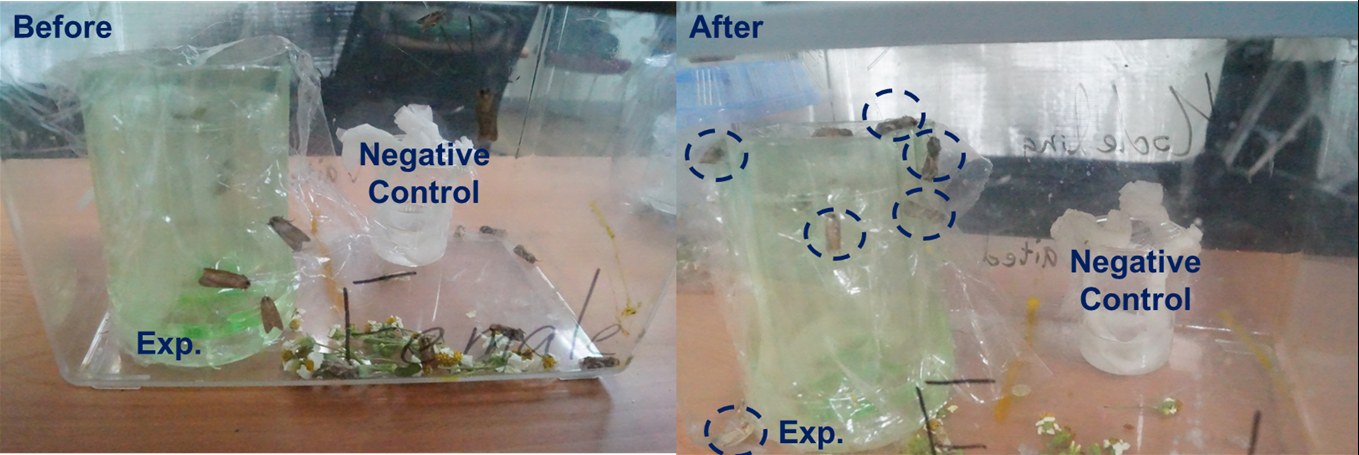
After observing the behavior female moth showed, we decided to conduct this experiment in the moth box to check the attractive effect of our idea, we hope our female moth after eating our PBAN can not only become excited, flapping its wings but also actually attract many male moths to aggregate together. We used two beakers which are the same as that we used in the former experiment, one contained PBAN solution and the other contained only sucrose solution as control and was put at two sides of the moth box. This time, we did a long time observation and took a picture with our camera below. Fig.2-3-1 shows the female moth eating our PBAN could attract more male moths than the female moth without eating our PBAN did. Thus, fig.2-3-1 can prove the fact that the female moth eating our PBAN can release much sex pheromone, and attract many male moths. In addition, we also did a simple test to compare our female moths eaing our PBAN with the sucrose solution ( the moth favorite food ) luring factor. Also, we can see the gigantic PBAN effect again.
Spodoptera Litura Hobby for Temperature and Light
Light can be probable of attracting target harmful female insects.
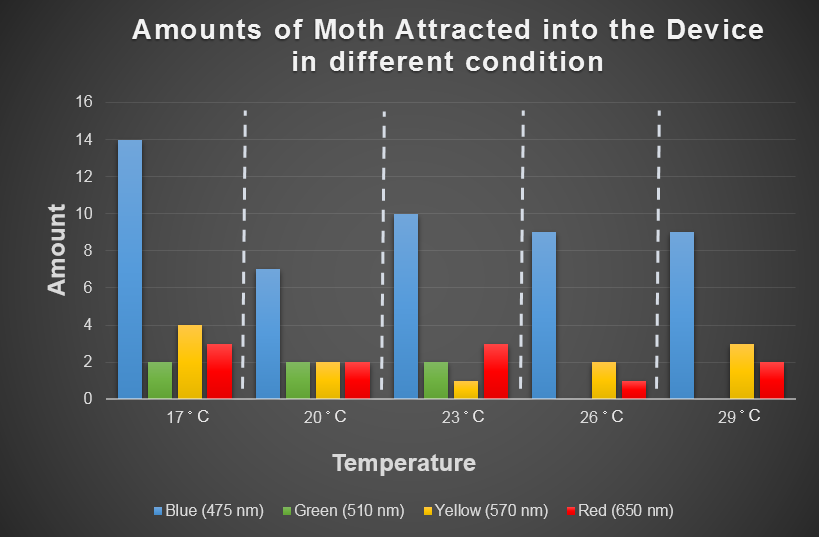
Temperature is the environmental factor which the farmer can not change practically. We want to use the computer modeling to deeply explore the relationship among light, temperature and the moths' hobby. In the future, we hope that farmers can choose the appropriate light according to temperature condition and even the kind of moths when using our device. For this, we choose the average temperature range in Taiwan in a year, and most common harmful insects, Spodoptera Litura to conduct this test (fig 2-3-3 below), which we want to use to model the relationship among light, temperature and the moths' hobby with ANFIS. (See detail in the device modeling page.)
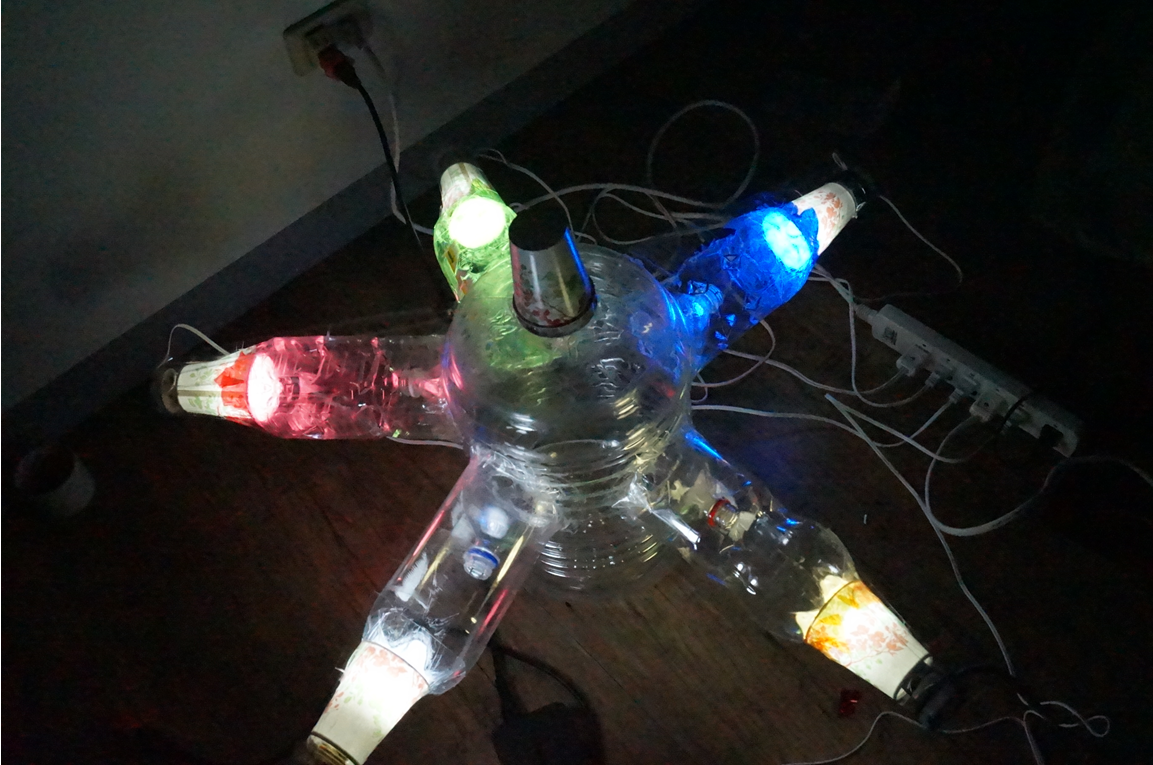
Fig 2-3-3 shows blue light have steady attraction to our target harmful moths, Spodoptera Litura, in any temperature condition. Thus, we decided to use blue LED light into our device design.
 "
"
