Team:BIOSINT Mexico/Switch
From 2014.igem.org
JuanjoQuispe (Talk | contribs) |
(→Light response) |
||
| (17 intermediate revisions not shown) | |||
| Line 8: | Line 8: | ||
</style> | </style> | ||
</html> | </html> | ||
| - | |||
| - | |||
<html><h1>Reset - Red light switch</h1> </html> | <html><h1>Reset - Red light switch</h1> </html> | ||
| Line 18: | Line 16: | ||
In the literature, the switch used two different light waves, deep red (660 nm) for the activation, and far red (740 nm) for the immediate and permanent deactivation of the de-greening system. However, for this project, we designed a system responsive only for the far red light and which only function is the inactivation of the degreening of the plant. | In the literature, the switch used two different light waves, deep red (660 nm) for the activation, and far red (740 nm) for the immediate and permanent deactivation of the de-greening system. However, for this project, we designed a system responsive only for the far red light and which only function is the inactivation of the degreening of the plant. | ||
| - | |||
The first three hundreds nucleotides of PIF6 (BBa_K1150005) are fused to the DNA-Binding Domain of the TetR (BBa_K909007) protein and attaches to its operator site upstream a minimal promoter (PCaMV 35S BBa_K788000), also, its fused with a Nuclear Localization Sequence (NLS: BBa_K1150010) and a polyadenylation tail (PolyA: BBa_K1150012). The activation domain was used in order to induce the system expression, as proposed by Müller,K. et al, attached to the DNA binding domain of TetR. | The first three hundreds nucleotides of PIF6 (BBa_K1150005) are fused to the DNA-Binding Domain of the TetR (BBa_K909007) protein and attaches to its operator site upstream a minimal promoter (PCaMV 35S BBa_K788000), also, its fused with a Nuclear Localization Sequence (NLS: BBa_K1150010) and a polyadenylation tail (PolyA: BBa_K1150012). The activation domain was used in order to induce the system expression, as proposed by Müller,K. et al, attached to the DNA binding domain of TetR. | ||
| + | [[File:Imagen1.png|500px|center]] | ||
The first 650 amino acids (1950 bp) of the Phytochrome B (BBa_K1150004) protein are fused to an eucaryotic transactivation domain (VP16: BBa_K105001) from Herpes simplex virus, a 3 amino acid protein linker (AGS: Linker BBa_K1150013) and the NLS and PolyA, everything attached to the same minimal promoter (PCaMV). | The first 650 amino acids (1950 bp) of the Phytochrome B (BBa_K1150004) protein are fused to an eucaryotic transactivation domain (VP16: BBa_K105001) from Herpes simplex virus, a 3 amino acid protein linker (AGS: Linker BBa_K1150013) and the NLS and PolyA, everything attached to the same minimal promoter (PCaMV). | ||
| Line 26: | Line 24: | ||
The components of the PhyB transcription factor (PhyB-VP16-NLS and tetR-PIF6) were under the control of a minimal promoter, specifically, the Cauliflower mosaic virus 35S promoter (PCaMV 35S) to optimize the red light inducible gene expression. (Müller,K. et al, 2013) This promoter was selected because it is widely used on plant genetic engineering, because its strength and constitutive nature. | The components of the PhyB transcription factor (PhyB-VP16-NLS and tetR-PIF6) were under the control of a minimal promoter, specifically, the Cauliflower mosaic virus 35S promoter (PCaMV 35S) to optimize the red light inducible gene expression. (Müller,K. et al, 2013) This promoter was selected because it is widely used on plant genetic engineering, because its strength and constitutive nature. | ||
| + | [[File:Imagen4.png|500px|center]] | ||
===Light response=== | ===Light response=== | ||
[[File:Degreening.PNG|400px|thumb|right|Layout of an experimental set-up for local red light-controlled gene expression in whole plants. To prevent activation of the red light-responsive gene switch in light-grown plants, supplementary 740 nm illumination is applied that constantly returns the system to the OFF state (müller et al, 2012).]] | [[File:Degreening.PNG|400px|thumb|right|Layout of an experimental set-up for local red light-controlled gene expression in whole plants. To prevent activation of the red light-responsive gene switch in light-grown plants, supplementary 740 nm illumination is applied that constantly returns the system to the OFF state (müller et al, 2012).]] | ||
| - | Proteins responsive to light called photoreceptors are present in plant cells and its main function is to provide information about the environment, about circadian, seasonal and positional information. This information is crucial in plant development, given that it controls many processes of the organism such as germination, seedling development, sleep movements and many others (Mathew, 2006 | + | Proteins responsive to light called photoreceptors are present in plant cells and its main function is to provide information about the environment, about circadian, seasonal and positional information. This information is crucial in plant development, given that it controls many processes of the organism such as germination, seedling development, sleep movements and many others (Mathew, 2006), and also, activate or regulate some cellular pathways, like chloroplast movement, cytoplasmic motility or endoreduplication |
Phytochromes are some kind of photoreceptors sensitive to different shades of red light, with a range of reception between 620 and 740 approximately, including deep red and far red light (∼660 nm and ∼740 nm wavelength). Because of its nature, and the difference with other plant pigments, that only absorb wavelengths lower than 700 nm, these molecules are specific for detecting small changes in environment, like detecting the the length of the day or the relative position to other plants. (Mathew, 2006) | Phytochromes are some kind of photoreceptors sensitive to different shades of red light, with a range of reception between 620 and 740 approximately, including deep red and far red light (∼660 nm and ∼740 nm wavelength). Because of its nature, and the difference with other plant pigments, that only absorb wavelengths lower than 700 nm, these molecules are specific for detecting small changes in environment, like detecting the the length of the day or the relative position to other plants. (Mathew, 2006) | ||
| Line 38: | Line 37: | ||
Phytochrome-PIF6 complex in its active form triggers the transcription of two small interference RNAs which are complementaries to two RBSs presents in the de-greening construct, thus, shouting off permanently this system. | Phytochrome-PIF6 complex in its active form triggers the transcription of two small interference RNAs which are complementaries to two RBSs presents in the de-greening construct, thus, shouting off permanently this system. | ||
| + | [[File:Imagen2.jpg|450px|center]] | ||
<html><h2>Modeling</h2> </html> | <html><h2>Modeling</h2> </html> | ||
| + | |||
| + | '''Equations for Phytochrome-PIF6 complex''' | ||
| + | <br>In order to produce proteins, in the cell, two main reactions happen. First, DNA is transcripted to mRNA and then it is translated to a peptide sequence, it could be represented in the reaction by: | ||
| + | [[File:BIOSINTmodelEC1.png|500px|center]] | ||
| + | All these reactions are mediated by two specific enzymes, which are RNA polymerase (transcription) and ribosome (translation). These reactions have been well described in literature and can be modeled to a Ordinary Differential Equation system. | ||
| + | <br>The rate of production of the PhyB construct is given by the rate of transcription of the protein from the mRNA molecule and the degradation of the messenger. Therefore: | ||
| + | [[File:BIOSINTmodelEC2.png|550px|center]] | ||
| + | Where γ is the translation rate of the cell, and α is the degradation of the degradation rate of the protein. | ||
| + | <br>Also, the concentration of the messenger molecule is given by the equation | ||
| + | [[File:BIOSINTmodelEC3.png|650px|center]] | ||
| + | Where a represents the activity of the promoter, that is related to the capacity of being activated or suppressed by a transcription factor; β is the maximal production rate of the CaMV promoter (which is attached upstream to PhyB) and is a linear function dependent on the time of the reaction; as in the last equation, α is the degradation rate. | ||
| + | <br>Also, since PCaMV is a constitutive promoter, the value of its activity is equal to 1. So the equation is reduced to | ||
| + | [[File:BIOSINTmodelEC4.png|600px|center]] | ||
| + | As PIF6 construct is connected to the same promoter, the equations of its expression are deduced by the same way, so: | ||
| + | [[File:BIOSINTmodelEC5.png|500px|center]] | ||
| + | [[File:BIOSINTmodelEC6.png|600px|center]] | ||
| + | In our system, both expressed gene constructs are part of another reaction in presence of deep red light (660 nm lightwave). When photoreceptor protein (PhyB construct) detects deep red light, it fuses to its interaction factor (PIF6 construct) and form a protein | ||
| + | <br>For the complex creation, follow the following reaction in presence of 660 nm light. | ||
| + | [[File:BIOSINTmodelEC7.png|500px|center]] | ||
| + | Where Ku is the constant of the reaction, and is on concentration units. And K-u is the constant for the inverse reaction (separation of the complex), and the active form of the complex can be abbreviated as CPPA. Then, we can infer the concentration of active complex by the equation. | ||
| + | [[File:BIOSINTmodelEC8.png|900px|center]] | ||
| + | Also, in presence of far red light, the complex passes to its inactive form, represented as CPPI, by the following reaction: | ||
| + | [[File:BIOSINTmodelEC9.png|300px|center]] | ||
| + | Where KD is the constant of the reaction and K-D equals zero, because deactivated complex can’t return to its active form. | ||
| + | [[File:BIOSINTmodelEC10.png|500px|center]] | ||
| + | Then, if we despise the degradation rate of the inactivation of the protein complex, we can simplify the calculi of concentration of active photo protein by replacing 6 in 5. | ||
| + | [[File:BIOSINTmodelEC11.png|880px|center]] | ||
| + | |||
| + | '''Equations for the repressor system''' | ||
| + | <br>The active protein complex that is formed by phyb construct and pif6 construct becomes a transcription factor that activates the production of two small interference RNAs. One is specific for the RBS1 sequence and the other for the IRES sequence. | ||
| + | <br>Since the complex has a binding domain that joins to the promoter inducible PCMV, the rate of production of the siRNAs is given by the strength of the promoter and its activity (which is proportional to the activation by CPPA). | ||
| + | <br>Since the activator has to bind to the DNA molecule in the promoter site, we use Hill’s function for macromolecules binding. | ||
| + | <br>From: | ||
| + | [[File:BIOSINTmodelEC.23.png|550px|center]] | ||
| + | Can be deduced for promoters with activators: | ||
| + | [[File:BIOSINTmodelEC.24.png|500px|center]] | ||
| + | To find the complete demonstrations for the Hill’s equation for inducible promoters, you can visit Aberdeen 2009 wiki. | ||
| + | <br>Then, the activity for our promoter can be expressed as: | ||
| + | [[File:BIOSINTmodelEC.25.png|500px|center]] | ||
| + | Where βPCMV is the maximum expression achieved by our promoter. Kd is the constant is the equilibrium constant for the attachement of the inducer and the promoter, and n is the Hill’s coefficient for the cooperative ligation Induce-promoter. | ||
| + | <br> | ||
| + | <br>Since the affinity of the tow molecules is high, the Hill’s coefficient is n>1, then, aPCMV, is also greater than one. Thus, the equations that models the expression of siRNAs are: | ||
| + | [[File:BIOSINTmodelEC.26.png|550px|center]] | ||
| + | [[File:BIOSINTmodelEC.27.png|550px|center]] | ||
| + | |||
| + | And given that both sequences are connected to the same promoter, the activity is the same for siRBS1 and siIRES. | ||
| + | |||
<html><h2>Results</h2> </html> | <html><h2>Results</h2> </html> | ||
| - | <html><h2>References</h2> </html> | + | We fused the promoter PCMV (BBa_K747096) to a YFP reporter (BBa_E0030). |
| + | |||
| + | In order to measure its expression, we culture transformed E.coli in agar plates and measured the fluorescense intensity every 45 minutes. After that, we obtained the following data. [Fig.1] | ||
| + | |||
| + | :::[[File:1res.png|150px|thumb|left|'''Figure 1''' YFP intensity every 45 minutes.]] | ||
| + | |||
| + | We made three repetitions, so in order to model the equation, we obtained the mean measure, therefore: | ||
| + | |||
| + | [[File:2res.png|300px|center]] | ||
| + | |||
| + | We analysed the data and using the Wolfram Mathematica software, we obtained the following equation that fits the data. | ||
| + | If we plot this equation, we obtain: | ||
| + | |||
| + | [[File:Model1res.png|400px|center]] | ||
| + | |||
| + | Where we can see that the intensity of YFP grows directly proportional to the time and concentration of the molecule. | ||
| + | |||
| + | <blockquote><font size="3">[[File:4res.png|600px|thumb|left|'''Figure 1'''intensity of YFP grows directly proportional to the time and concentration of the molecule. | ||
| + | ''.]]</font></blockquote> | ||
| + | |||
| + | |||
| + | <html><h2>References</h2> | ||
| + | <p>Müller, K., Siegel, D., Jahnke, F. R., Gerrer, K., Wend, S., Decker, E. L., ... & Zurbriggen, M. D. (2014). A red light-controlled synthetic gene expression switch for plant systems. Molecular BioSystems, 10(7), 1679-1688. | ||
| + | |||
| + | <p>Mathews, S. (2006). Phytochrome‐mediated development in land plants: red light sensing evolves to meet the challenges of changing light environments.Molecular Ecology, 15(12), 3483-3503. | ||
| + | </html> | ||
Latest revision as of 03:47, 18 October 2014
Reset - Red light switch
Description
We incorporate a red light-responsive gene expression system using far red (740 nm) light wave. This far red light sensor works as a switch that inactivates the expression of the de-greening system genes, is based on the interaction between the Phytochrome B and the phytochrome-interacting factor 6 (PIF6) from A. thaliana (Müller,K. et al, 2013).
In the literature, the switch used two different light waves, deep red (660 nm) for the activation, and far red (740 nm) for the immediate and permanent deactivation of the de-greening system. However, for this project, we designed a system responsive only for the far red light and which only function is the inactivation of the degreening of the plant.
The first three hundreds nucleotides of PIF6 (BBa_K1150005) are fused to the DNA-Binding Domain of the TetR (BBa_K909007) protein and attaches to its operator site upstream a minimal promoter (PCaMV 35S BBa_K788000), also, its fused with a Nuclear Localization Sequence (NLS: BBa_K1150010) and a polyadenylation tail (PolyA: BBa_K1150012). The activation domain was used in order to induce the system expression, as proposed by Müller,K. et al, attached to the DNA binding domain of TetR.
The first 650 amino acids (1950 bp) of the Phytochrome B (BBa_K1150004) protein are fused to an eucaryotic transactivation domain (VP16: BBa_K105001) from Herpes simplex virus, a 3 amino acid protein linker (AGS: Linker BBa_K1150013) and the NLS and PolyA, everything attached to the same minimal promoter (PCaMV).
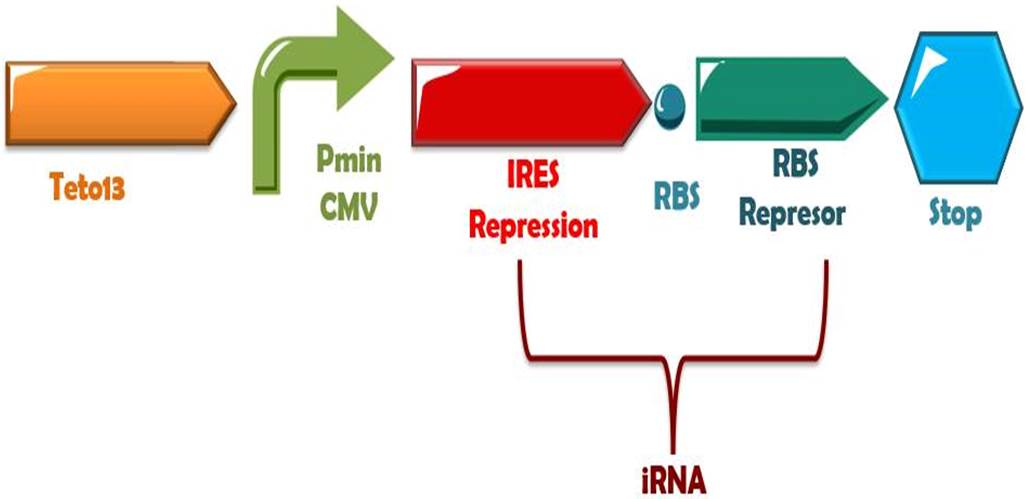
In presence of far red light, the phytochrome and PIF6 complex will transform to its active form, and subsequently, it will activate the production of the small interference RNAs (RBS1 and IRES), that binds to the mRNA of the de-greening system at the RBSs positions, thus, stopping the binding of the ribosomes and the traduction of the messenger to protein. Also, on dark times this system can be turned OFF for several hours (Müller,K. et al, 2013)
The components of the PhyB transcription factor (PhyB-VP16-NLS and tetR-PIF6) were under the control of a minimal promoter, specifically, the Cauliflower mosaic virus 35S promoter (PCaMV 35S) to optimize the red light inducible gene expression. (Müller,K. et al, 2013) This promoter was selected because it is widely used on plant genetic engineering, because its strength and constitutive nature.
Light response

Proteins responsive to light called photoreceptors are present in plant cells and its main function is to provide information about the environment, about circadian, seasonal and positional information. This information is crucial in plant development, given that it controls many processes of the organism such as germination, seedling development, sleep movements and many others (Mathew, 2006), and also, activate or regulate some cellular pathways, like chloroplast movement, cytoplasmic motility or endoreduplication
Phytochromes are some kind of photoreceptors sensitive to different shades of red light, with a range of reception between 620 and 740 approximately, including deep red and far red light (∼660 nm and ∼740 nm wavelength). Because of its nature, and the difference with other plant pigments, that only absorb wavelengths lower than 700 nm, these molecules are specific for detecting small changes in environment, like detecting the the length of the day or the relative position to other plants. (Mathew, 2006)
PIF6 construct (PIF6-TetR BD-NLS) and Phytochrome-B construct (PhyB-VP16 AD-AGS-NLS-PolyA) are both attached to the same promoter, so the expression of both constructs is equal and the concentration of both proteins is the same. In the cytoplasm, these proteins are found floating free in the cytosol when the environmental conditions are normal.
However, absorption of photons of deep red light (660 nm) makes the proteins form a complex, thus, going through its active form, and switching the system to its ON state. Alike, if cells are exposed to far red light (740 nm wavelength) the system could be permanently turning to the off state (Mueller et al, 2013)
Phytochrome-PIF6 complex in its active form triggers the transcription of two small interference RNAs which are complementaries to two RBSs presents in the de-greening construct, thus, shouting off permanently this system.
Modeling
Equations for Phytochrome-PIF6 complex
In order to produce proteins, in the cell, two main reactions happen. First, DNA is transcripted to mRNA and then it is translated to a peptide sequence, it could be represented in the reaction by:
All these reactions are mediated by two specific enzymes, which are RNA polymerase (transcription) and ribosome (translation). These reactions have been well described in literature and can be modeled to a Ordinary Differential Equation system.
The rate of production of the PhyB construct is given by the rate of transcription of the protein from the mRNA molecule and the degradation of the messenger. Therefore:
Where γ is the translation rate of the cell, and α is the degradation of the degradation rate of the protein.
Also, the concentration of the messenger molecule is given by the equation
Where a represents the activity of the promoter, that is related to the capacity of being activated or suppressed by a transcription factor; β is the maximal production rate of the CaMV promoter (which is attached upstream to PhyB) and is a linear function dependent on the time of the reaction; as in the last equation, α is the degradation rate.
Also, since PCaMV is a constitutive promoter, the value of its activity is equal to 1. So the equation is reduced to
As PIF6 construct is connected to the same promoter, the equations of its expression are deduced by the same way, so:
In our system, both expressed gene constructs are part of another reaction in presence of deep red light (660 nm lightwave). When photoreceptor protein (PhyB construct) detects deep red light, it fuses to its interaction factor (PIF6 construct) and form a protein
For the complex creation, follow the following reaction in presence of 660 nm light.
Where Ku is the constant of the reaction, and is on concentration units. And K-u is the constant for the inverse reaction (separation of the complex), and the active form of the complex can be abbreviated as CPPA. Then, we can infer the concentration of active complex by the equation.
Also, in presence of far red light, the complex passes to its inactive form, represented as CPPI, by the following reaction:
Where KD is the constant of the reaction and K-D equals zero, because deactivated complex can’t return to its active form.
Then, if we despise the degradation rate of the inactivation of the protein complex, we can simplify the calculi of concentration of active photo protein by replacing 6 in 5.
Equations for the repressor system
The active protein complex that is formed by phyb construct and pif6 construct becomes a transcription factor that activates the production of two small interference RNAs. One is specific for the RBS1 sequence and the other for the IRES sequence.
Since the complex has a binding domain that joins to the promoter inducible PCMV, the rate of production of the siRNAs is given by the strength of the promoter and its activity (which is proportional to the activation by CPPA).
Since the activator has to bind to the DNA molecule in the promoter site, we use Hill’s function for macromolecules binding.
From:
Can be deduced for promoters with activators:
To find the complete demonstrations for the Hill’s equation for inducible promoters, you can visit Aberdeen 2009 wiki.
Then, the activity for our promoter can be expressed as:
Where βPCMV is the maximum expression achieved by our promoter. Kd is the constant is the equilibrium constant for the attachement of the inducer and the promoter, and n is the Hill’s coefficient for the cooperative ligation Induce-promoter.
Since the affinity of the tow molecules is high, the Hill’s coefficient is n>1, then, aPCMV, is also greater than one. Thus, the equations that models the expression of siRNAs are:
And given that both sequences are connected to the same promoter, the activity is the same for siRBS1 and siIRES.
Results
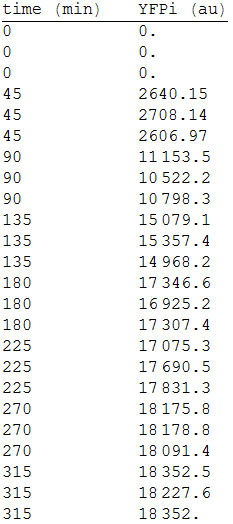
We fused the promoter PCMV (BBa_K747096) to a YFP reporter (BBa_E0030).
In order to measure its expression, we culture transformed E.coli in agar plates and measured the fluorescense intensity every 45 minutes. After that, we obtained the following data. [Fig.1]
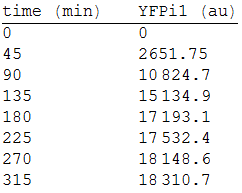
We made three repetitions, so in order to model the equation, we obtained the mean measure, therefore:
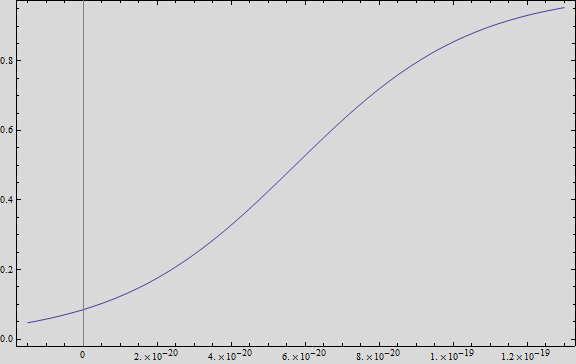
We analysed the data and using the Wolfram Mathematica software, we obtained the following equation that fits the data. If we plot this equation, we obtain:
Where we can see that the intensity of YFP grows directly proportional to the time and concentration of the molecule.
References
Müller, K., Siegel, D., Jahnke, F. R., Gerrer, K., Wend, S., Decker, E. L., ... & Zurbriggen, M. D. (2014). A red light-controlled synthetic gene expression switch for plant systems. Molecular BioSystems, 10(7), 1679-1688.
Mathews, S. (2006). Phytochrome‐mediated development in land plants: red light sensing evolves to meet the challenges of changing light environments.Molecular Ecology, 15(12), 3483-3503.
 "
"


