Team:ETH Zurich/expresults/qs/tab-plux
From 2014.igem.org
(Difference between revisions)
| (24 intermediate revisions not shown) | |||
| Line 1: | Line 1: | ||
{|class="wikitable" style="background-color: white; text-align:center; width:auto; margin: auto;" | {|class="wikitable" style="background-color: white; text-align:center; width:auto; margin: auto;" | ||
| - | |+'''Table 1''' Crosstalk matrix for the promoter | + | |+'''Table 1''' Crosstalk matrix for the promoter pLux ([http://parts.igem.org/Part:BBa_R0062:Experience BBa_R0062]) |
| - | + | |colspan="4" style='font-size:10pt';text-align:left| | |
| - | + | In all the measurements conducted to create this matrix the [http://parts.igem.org/Part:BBa_R0062 promoter pLux] was the basis and was induced in six different variations shown. | |
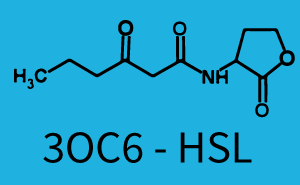
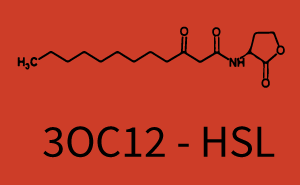
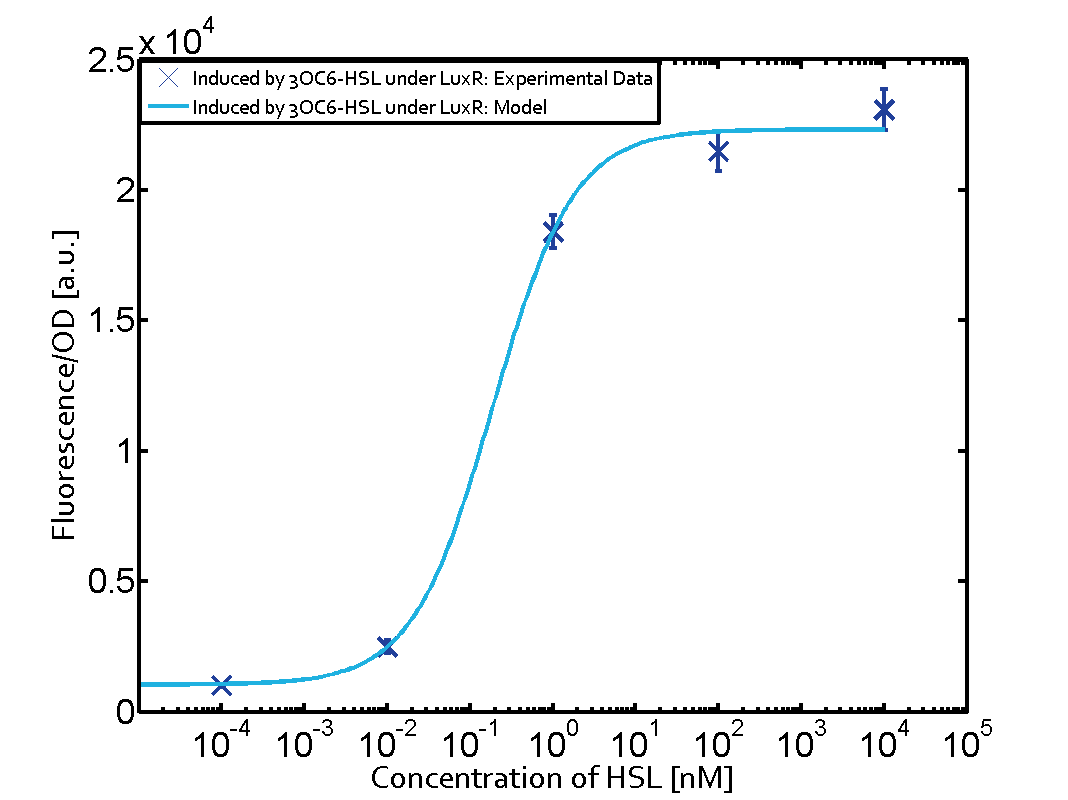
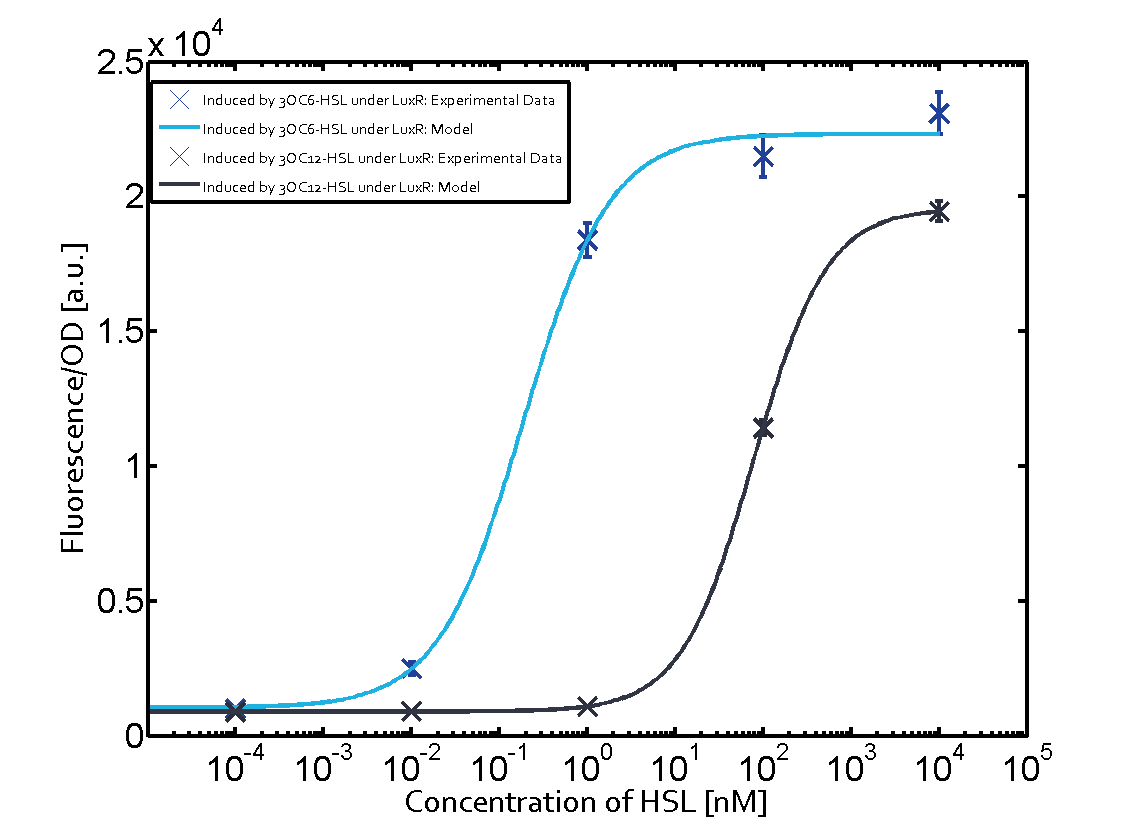
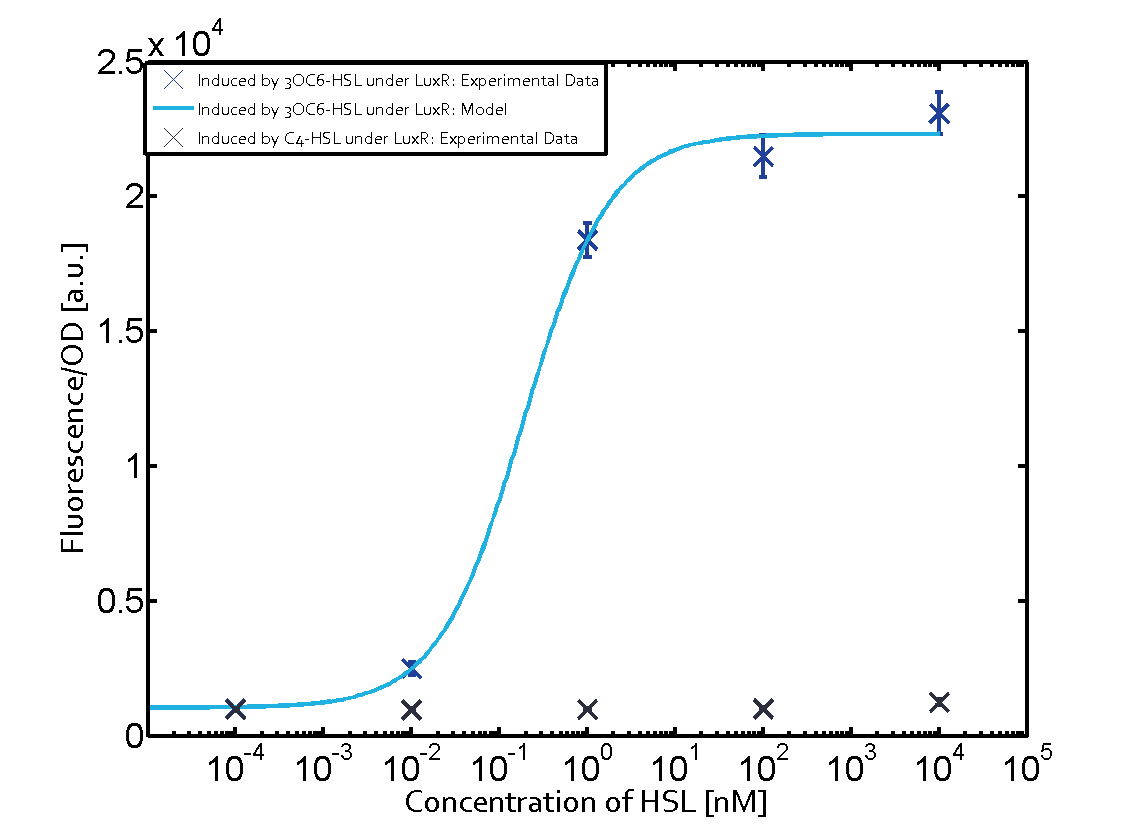
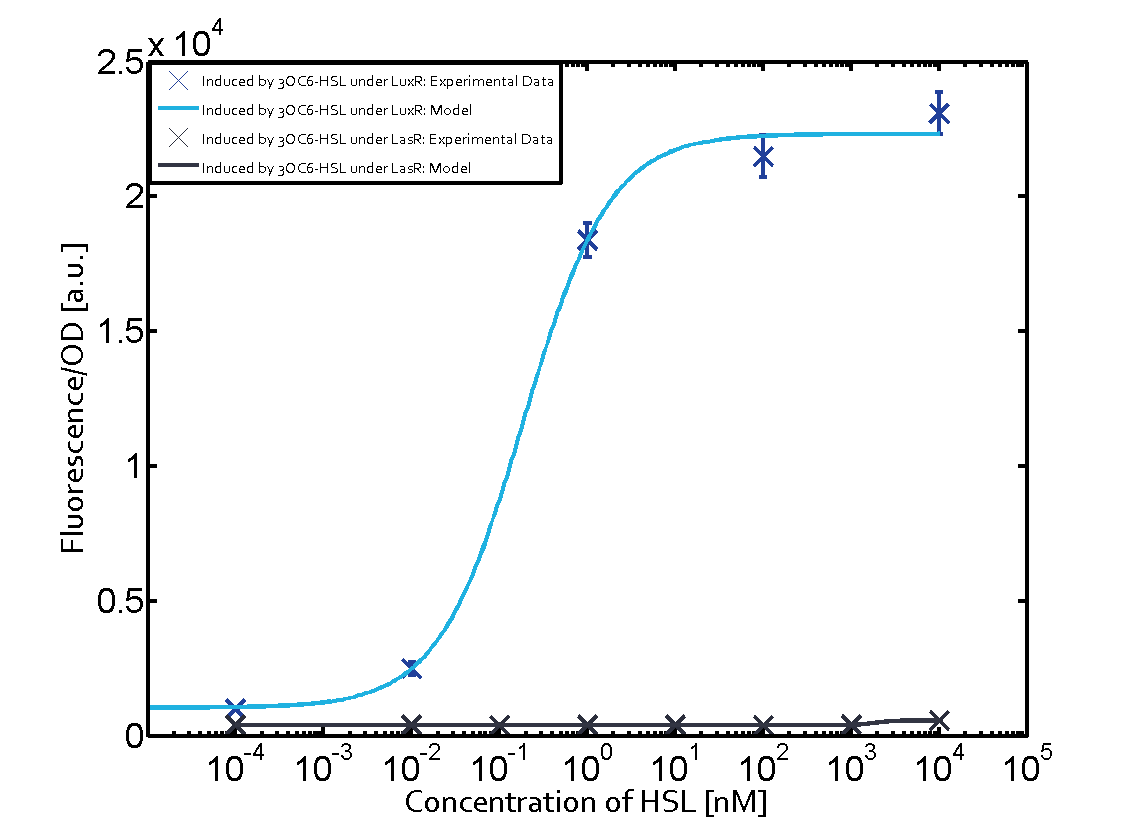
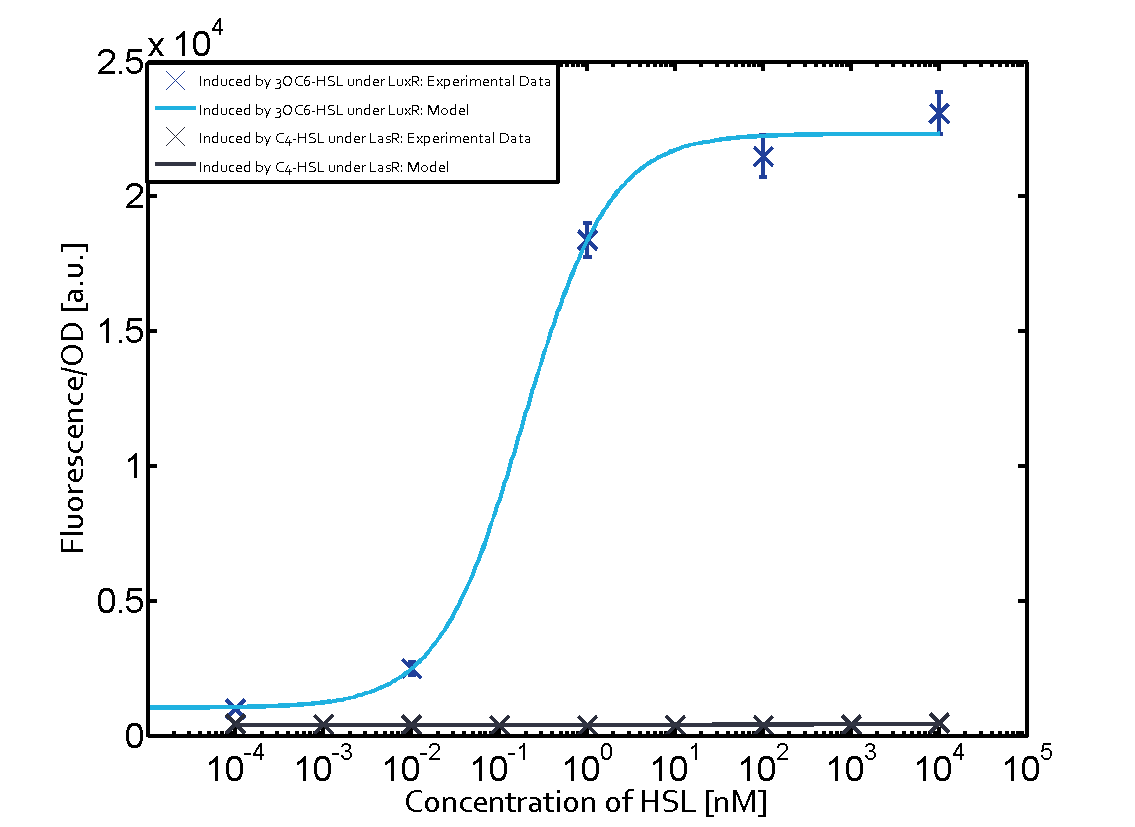
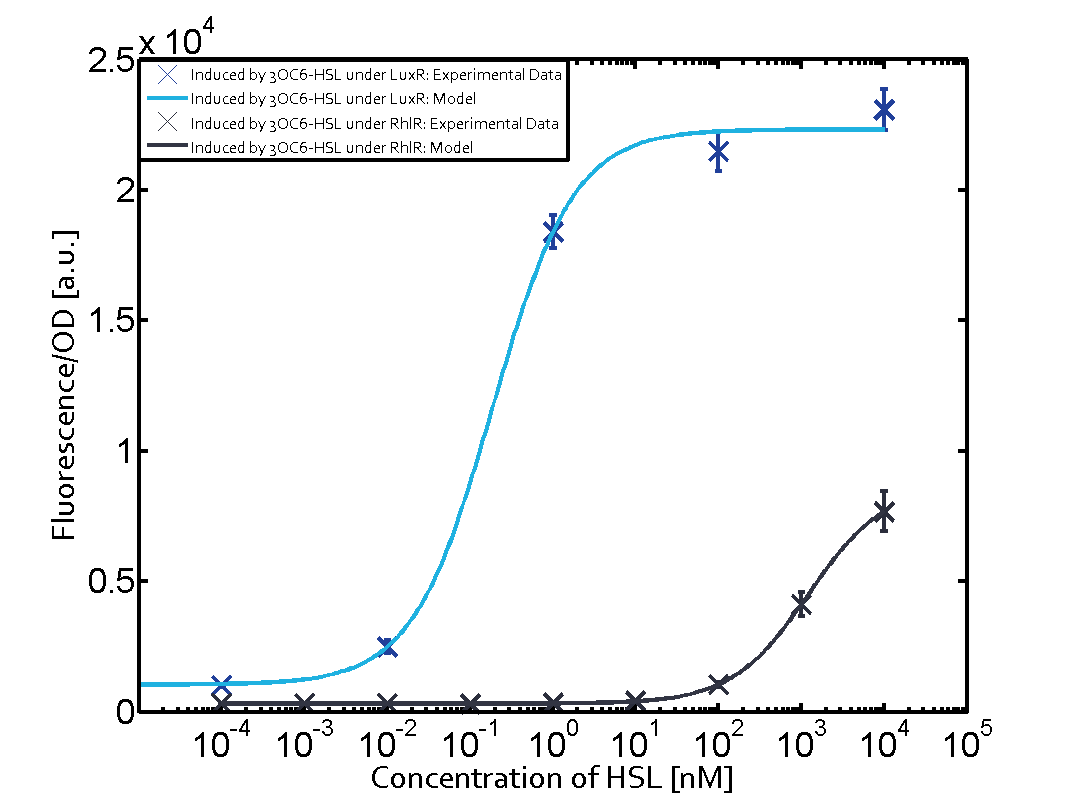
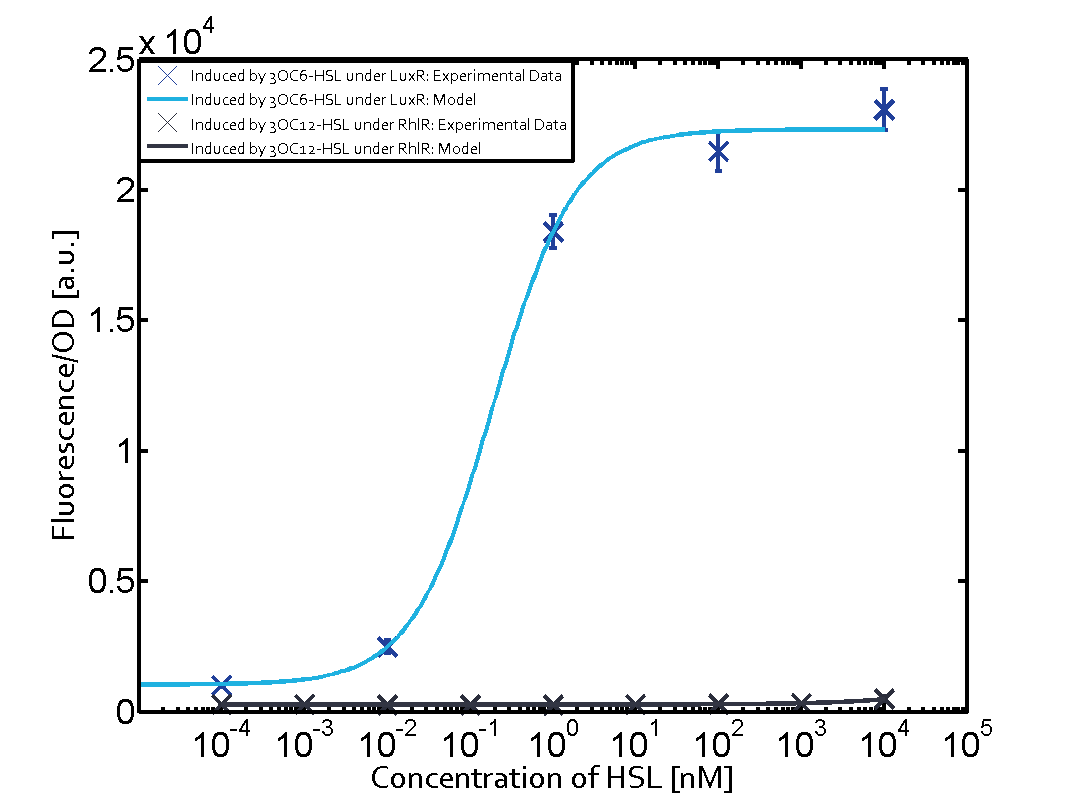
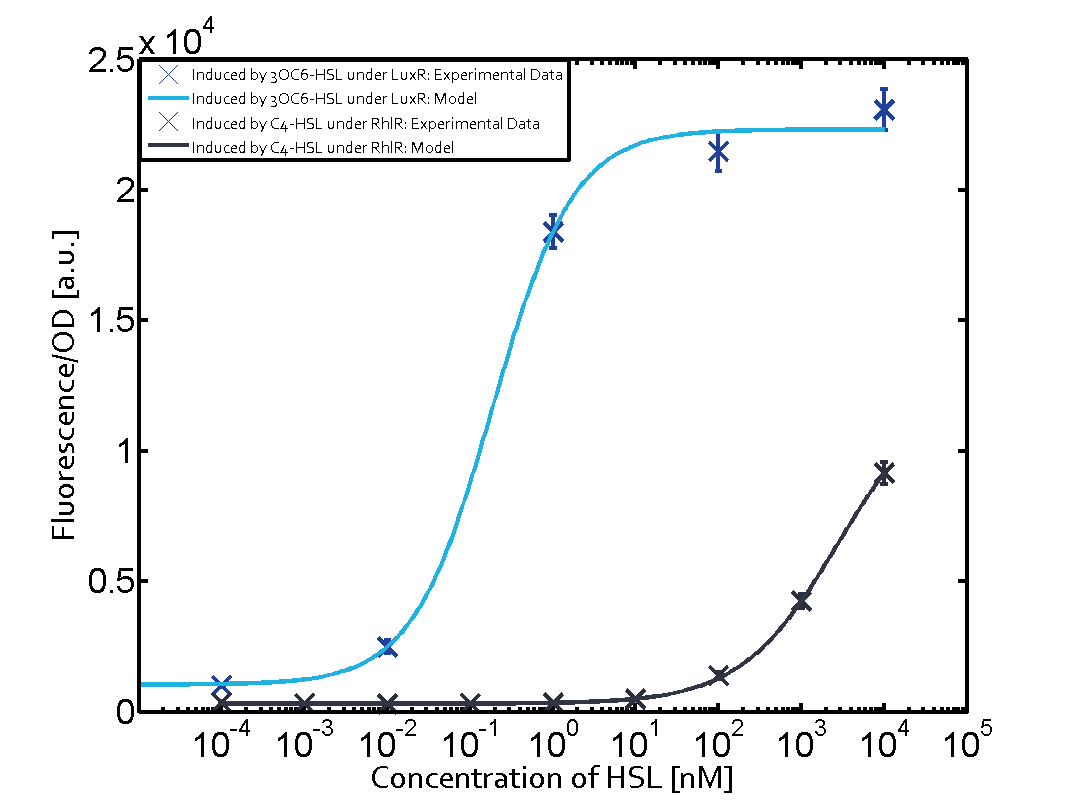
| - | In all the measurements conducted to create this matrix the promoter pLux was the basis and was induced in six different variations shown. | + | The dark blue points in the graph top left show the activation of gene expression when [http://parts.igem.org/Part:BBa_R0062 pLux] is induced by 3OC6-HSL (Lux-AHL) binding to the corresponding [http://parts.igem.org/Part:BBa_C0062 LuxR regulator]. The observed transition occurs at a concentration of approximately 1 nM of 3OC6-HSL. The light-blue curve plotted shows modeling data of [http://parts.igem.org/Part:BBa_R0062 pLux] induced by 3OC6-HSL (Lux-AHL) binding to the corresponding [http://parts.igem.org/Part:BBa_C0062 LuxR regulator]. This curve from the model and the dark blue data points obtained from experiments were plotted as a reference in all the other graphs describing [http://parts.igem.org/Part:BBa_R0062 pLux]. Crosstalk can be observed for the cases where the 3OC12-HSL (Las-AHL) binds the [http://parts.igem.org/Part:BBa_C0062 LuxR regulator]. |
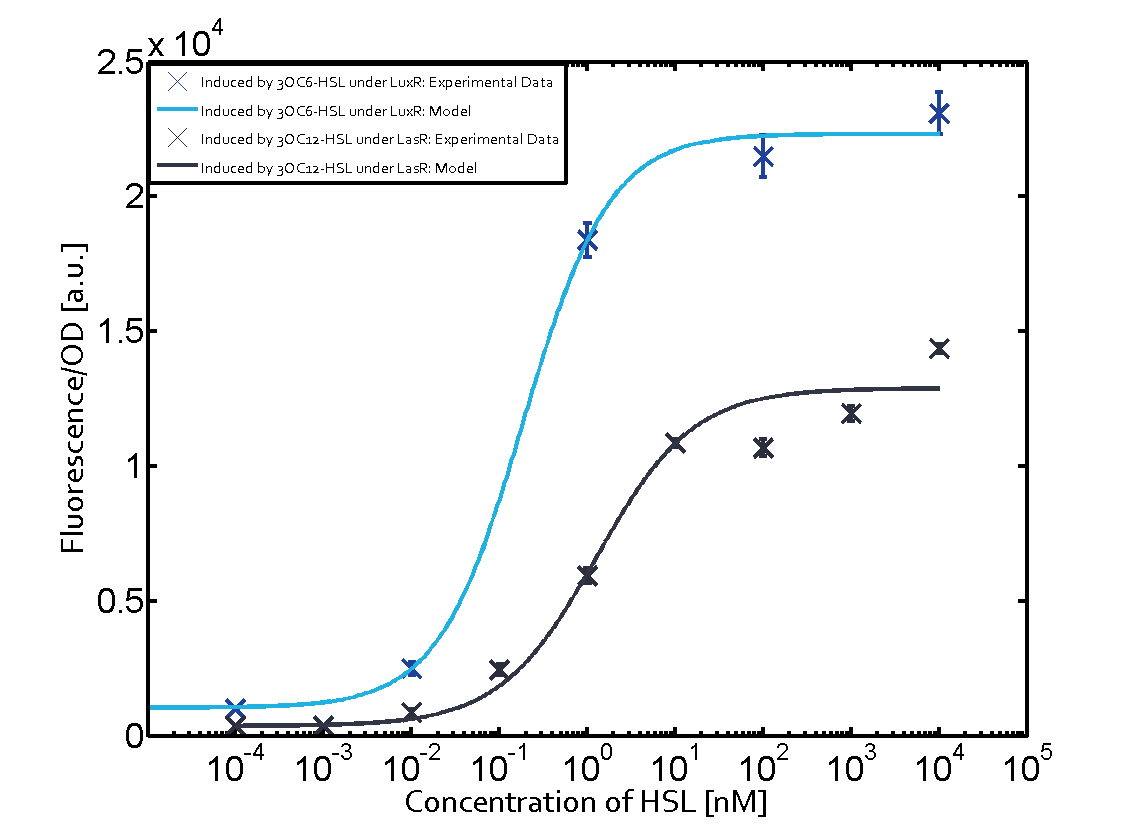
| - | The dark blue points in the graph top left show the activation of gene expression when pLux is induced by 3OC6-HSL (Lux-AHL) binding to the corresponding LuxR regulator. The observed transition occurs at a concentration of approximately 1 nM 3OC6-HSL. The light-blue curve plotted shows modeling data of pLux induced by 3OC6-HSL (Lux-AHL) binding to the corresponding LuxR regulator. This curve from the model and the dark blue data | + | Additionally for 3OC12-HSL binding to its corresponding [http://parts.igem.org/Part:BBa_C0179 regulator LasR] and then binding to the [http://parts.igem.org/Part:BBa_R0062 pLux] as seen in the middle of the top row and center of the matrix. |
| - | + | For the case of Las-AHL binding the [http://parts.igem.org/Part:BBa_C0179 regulator LasR] and subsequently the [http://parts.igem.org/Part:BBa_R0062 promoter pLux], the transition occurs at 1 nM and reaches 0.5 fold the fluorescence as [http://parts.igem.org/Part:BBa_R0062 pLux] induced by 3OC6-HSL binding [http://parts.igem.org/Part:BBa_C0062 LuxR]. In the case of 3OC12-HSL binding [http://parts.igem.org/Part:BBa_C0062 LuxR] and inducing the promoter [http://parts.igem.org/Part:BBa_R0062 pLux], the transition is observed at approximately 100 nM and severe crosstalk is observed, meaning that the ON-OFF-ratio is not significantly different from the reference curve. | |
| - | Crosstalk can be observed for the cases where the 3OC12-HSL (Las-AHL) binds the LuxR regulator. | + | |
| - | For the case of Las-AHL binding the LasR and subsequently the promoter pLux, the transition occurs at 1 nM and reaches 0.5 fold the fluorescence as pLux induced by 3OC6-HSL binding LuxR. | + | |
| - | In the case of 3OC12-HSL binding LuxR and inducing the promoter pLux, the transition is observed at approximately 100 nM and severe crosstalk is observed | + | |
| - | + | ||
| - | + | ||
| - | + | ||
| - | + | ||
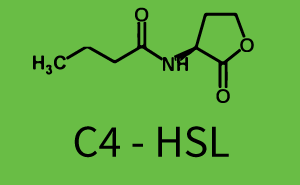
| + | Observation of C4-HSL has shown, that there is no significant crosstalk with the [http://parts.igem.org/Part:BBa_C0062 LuxR regulator] and [http://parts.igem.org/Part:BBa_C0179 LasR regulator] binding C4-HSL and subsequently to [http://parts.igem.org/Part:BBa_R0062 pLux]. This is indicated on top right and middle right graphs. However, [http://parts.igem.org/Part:BBa_C0171 RhlR] induced with its corresponding inducer (C4-HSL) binds to [http://parts.igem.org/Part:BBa_R0062 pLux] and activates expression of GFP at about 100 nM. | ||
| + | |- | ||
|style="width:200px"|[[File:ETH_Zurich_2014_qs-table_CornerLux.png|200px|link=http://parts.igem.org/Part:BBa_C0062:Experience]] | |style="width:200px"|[[File:ETH_Zurich_2014_qs-table_CornerLux.png|200px|link=http://parts.igem.org/Part:BBa_C0062:Experience]] | ||
|[[File:ETH_Zurich_2014_qs-table_3OC6-HSL.png|200px|link=http://parts.igem.org/Part:BBa_C0062:Experience]] | |[[File:ETH_Zurich_2014_qs-table_3OC6-HSL.png|200px|link=http://parts.igem.org/Part:BBa_C0062:Experience]] | ||
 "
"

