Team:Valencia UPV/Modeling/fba
From 2014.igem.org
Alejovigno (Talk | contribs) |
|||
| (65 intermediate revisions not shown) | |||
| Line 4: | Line 4: | ||
<script type="text/javascript" src="http://ajax.googleapis.com/ajax/libs/jquery/1.11.1/jquery.min.js"></script> | <script type="text/javascript" src="http://ajax.googleapis.com/ajax/libs/jquery/1.11.1/jquery.min.js"></script> | ||
| - | <div align="center"><div id="cn-box" align="justify"></br> | + | <div align="center"><div id="cn-box" align="justify"> |
| + | <h3 class="hook" align="left"><a href="#">Modeling</a> > <a href="https://2014.igem.org/Team:Valencia_UPV/Modeling/fba">Pheromone Production</a></h3></p></br> | ||
| - | <div align="center">< | + | <div align="center"><span class="coda"><roja>P</roja>heromone <roja>P</roja>roduction</span> </div> |
| + | </br></br> | ||
<div class="tabs"> | <div class="tabs"> | ||
<ul class="tab-links"> | <ul class="tab-links"> | ||
<li class="active"><a href="#tab1">Introduction</a></li> | <li class="active"><a href="#tab1">Introduction</a></li> | ||
| - | <li><a href="#tab2"> | + | <li><a href="#tab2">FBA Analysis</a></li> |
| - | <li><a href="#tab3">Results</a></li> | + | <!--<li><a href="#tab3">Results</a></li> |
| - | + | <li><a href="#tab4">Tab #4</a></li> --> | |
</ul> | </ul> | ||
<div class="tab-content"> | <div class="tab-content"> | ||
| - | <div id="tab1" class="tab active" | + | <div id="tab1" class="tab active"><br/> |
| - | + | ||
| - | < | + | <h3>The Idea</h3><br/> |
| - | < | + | <p>Pheromones production rates can be estimated using constrained-based modeling of metabolic networks.This can be useful to know the amount of pheromone that can be produced by the synthetic plant.</p><br/> |
| - | Constraint-based | + | <h3>Constraint-based modeling</h3><br/> |
| - | that limit their behaviour | + | |
| + | Constraint-based modeling use models of the cell metabolism that are derived from a metabolic network (stoichiometric models) and assume steady-state for the intracellular metabolites. These two constraints are the base of constraint- | ||
| + | |||
| + | based modeling: the fact that cells are subject to constraints that limit their behaviour [1]. In principle, if all constraints operating under | ||
a given set of circumstances were known, the actual state of a metabolic network | a given set of circumstances were known, the actual state of a metabolic network | ||
could be elucidated. So by imposing the known constraints, it is possible to determine which functional states can and cannot be achieved by a cell. | could be elucidated. So by imposing the known constraints, it is possible to determine which functional states can and cannot be achieved by a cell. | ||
| + | </html> | ||
| + | [[File:Stoich_model.png|600px|center|Principles of the stoichiometric modeling framework. Given a metabolic network, the | ||
| + | mass balance around each intracellular metabolite can be mathematically represented with an ordinary | ||
| + | differential equation. If we do not consider intracellular dynamics, the mass balances can be described | ||
| + | by a homogeneous system of linear equations: the so-called general equation. Other constraints can be | ||
| + | also incorporated to further restrict the space of feasible flux states of cells. From: PhD Thesis. F Llaneras. UPV. 2010]]<html> | ||
</p><br/> | </p><br/> | ||
| Line 42: | Line 52: | ||
because they are those that are always satisfied (i.e, they limit the cell capabilities). If | because they are those that are always satisfied (i.e, they limit the cell capabilities). If | ||
adjustable constraints are used, the elucidated cell states will be only valid under the | adjustable constraints are used, the elucidated cell states will be only valid under the | ||
| - | particular set of circumstances in which these constraints operate. | + | particular set of circumstances in which these constraints operate [2]. |
</p><br/></html> | </p><br/></html> | ||
| - | [[File:Contrainedbm.png|600px|center]]<html> | + | [[File:Contrainedbm.png|600px|center|Space of feasible steady-state flux vectors by non-adjustable constraints. From: PhD Thesis. F Llaneras. UPV. 2010]]<html><br/> |
| - | <h3>Flux Balance Analysis</h3><br/> | + | <h3>Flux Balance Analysis</h3><br/> |
| - | <p>Flux balance analysis (FBA) is a | + | <p>Flux balance analysis (FBA) is a methodology that uses optimisation to get predictions |
| + | from a constraint-based model by invoking an assumption of optimal cell behaviour. Basically, | ||
| + | one particular state among those that cells can show, accordingly to a constraint-based | ||
| + | model, is chosen based on the assumption that cells have evolved to be optimal, i.e., | ||
| + | that cells regulate its fluxes toward optimal flux states. | ||
| + | The following procedure is used to develop a flux balance analysis model: | ||
| + | </p><br/></html> | ||
| + | [[File:FBA_steps.png|600px|center|Procedure to develop a flux balance analysis model. From: PhD Thesis. F Llaneras. UPV. 2010]]<html><br/> | ||
| + | <p> | ||
| + | Flux balance analysis is used to investigate hypothesis (e.g., test if a | ||
| + | reduced uptake capacity can be the cause of an unexpected cell behaviour) and to | ||
| + | evaluate a range of possibilities (e.g, find the best combination of substrates). | ||
| + | </p><br/> | ||
| - | < | + | <h4>Metabolic objectives and optimization</h4><br/> |
| - | <p> | + | <p> |
| - | + | It must be taken into account that FBA predictions, the optimal flux state, may not | |
| - | < | + | correspond to the actual fluxes exhibited by cells. To support the assumption of optimal |
| - | < | + | behaviour, it must be hypothesised that: (i) cells, forced by evolutionary pressure, |
| - | of Bioscience and Bioengineering, 105:1.</ | + | evolved to achieve an optimal behaviour with respect to certain objective, (ii) we know |
| + | which this objective is, and (iii) the objective can be expressed, at least approximately, | ||
| + | in convenient mathematical terms.</p> | ||
| + | <p> | ||
| + | Clearly, predictions of flux balance analysis are dependent on the objective function | ||
| + | being used. To date, the most commonly used objective function has been the maximisation | ||
| + | of biomass, which leaded to predictions consistent with experimental data | ||
| + | for different organisms, such as <i>Escherichia coli</i> [3].</p><br/> | ||
| + | <h4>Genome-scale and plant models</h4><br/> | ||
| + | <p> | ||
| + | FBA is widely used for predicting metabolism, in particular the genome-scale metabolic network reconstructions that have been built in the past decade. These reconstructions contain all of the known metabolic reactions in an organism, | ||
| + | |||
| + | and the genes that encode each enzyme. In our case, FBA will calculate the flow of metabolites through our metabolic network to obtain the maximum production of pheromone. It must be noted that plant genome-scale models are very rare | ||
| + | |||
| + | and, indeed, plant FBA is a very new research topic. One of the very few available plant models is the AraGEM model [4], a genome-scale of <i>Arabidopsis Thaliana</i>.</p><br/> | ||
| + | |||
| + | </p><br/></html> | ||
| + | [[File:Aragem_excelc.png|600px|center|AraGEM: Genome-scale reconstruction network of <i>A. Thaliana</i> metabolism. From: ARAGem]]<html> | ||
| + | |||
| + | |||
| + | <p align="left"><strong>References</strong></p><br/> | ||
| + | <div style="position: relative; left: 3%; width: 96%;"> | ||
| + | <ol> | ||
| + | <li> Palsson BO (2006). Systems biology: properties of reconstructed networks. New York, USA: Cambridge University Press New York.</li> | ||
| + | <li> Llaneras F, Picó J (2008). Stoichiometric Modelling of Cell Metabolism. Journal of Bioscience and Bioengineering, 105:1.</li> | ||
| + | <li> Edwards JS, Covert M, Palsson B (2002). Metabolic modelling of microbes: the | ||
| + | flux-balance approach. Environmental Microbiology, 4:133-140.</li> | ||
| + | <li> de Oliveira Dal'Molin CG1, Quek LE, Palfreyman RW, Brumbley SM, Nielsen LK. AraGEM, a genome-scale reconstruction of the primary metabolic network in Arabidopsis. NCBI, Plant Physiol. 2010 Feb;152(2):579-89. doi: | ||
| + | |||
| + | 10.1104/pp.109.148817. Epub 2009 Dec 31. </li> | ||
| + | </ol> | ||
</div> | </div> | ||
| + | |||
| + | |||
| + | |||
| + | </div> | ||
| - | + | <div id="tab2" class="tab"><br/> | |
| - | + | <h3>COBRA </h3><br/> | |
| + | <p> | ||
| + | The COnstraints Based Reconstruction and Analysis (COBRA) approach to systems biology accepts the fact that we do not possess sufficiently detailed parameter data to precisely model, in the biophysical sense, an organism or plant at the | ||
| + | |||
| + | genome scale [1]. | ||
| + | The COBRA Toolbox is a freely available Matlab toolbox can be used to perform a variety of COBRA methods, including many FBA-based methods. Models for the COBRA Toolbox are saved in the Systems Biology Markup Language (SBML). | ||
| + | </p><br/> | ||
| + | <h3> AraGEM Model </h3><br/> | ||
| + | <p> | ||
| + | AraGEM [2] is the genome-scale metabolic network model covering primary metabolism for a compartmentalized plant cell based on the Arabidopsis (<i>Arabidopsis Thaliana</i>) genome. AraGEM is a comprehensive literature-based model, | ||
| + | |||
| + | that accounts for the functions of 1,419 unique open reading frames, 1,737 metabolites, 5,253 gene-enzyme reaction-association entries, and 1,601 unique reactions compartmentalized into the cytoplasm, mitochondrion, plastid, peroxisome, | ||
| + | |||
| + | and vacuole. Using efficient resource utilization as the optimality criterion, AraGEM has already been used to predict the classical photorespiratory cycle as well as known key differences between redox metabolism in photosynthetic and | ||
| + | |||
| + | nonphotosynthetic plant cells.</p> | ||
| + | </html> | ||
| + | [[File:Metabolite.png|800px|center|Figure 1. In AraGEM, palmitic acid is also called Hexadecanoic acid_acc. The metabolic network was built using 1737 metabolites and 1601 reactions. ]] | ||
| + | <html> | ||
| + | <p style="text-align: justify; font-style: italic; font-size: 0.8em; width: 700px;"><span class="black-bold">Figure 1</span>. In AraGEM, palmitic acid is also called Hexadecanoic Acid_acc. The reaction added ExZ11 produces the efflux | ||
| + | |||
| + | V<sub>3</sub> known as palmitic acid exchange.</p> | ||
| + | <br/> | ||
| + | <br/> | ||
| + | <p> | ||
| + | AraGEM is a viable framework for in silico functional analysis and can be used to derive new, nontrivial hypotheses for exploring plant metabolism. We take for granted that AraGEM is the genome-scale metabolic network model that | ||
| + | |||
| + | currently better approximates the metabolism model of <i>N. benthamiana</i>. In <span class="red-bold">Sexy Plant</span> we have added <i>in silico </i> the reactions from the network of pheromone production. As optimality criterion | ||
| + | we sought to <span class="black-bold">maximize the pheromone flux</span> produced by the plant.</p><br/> | ||
| + | <h3> Pheromone pathway location </h3><br/> | ||
| + | <br/> | ||
| + | </html> | ||
| + | [[File:Precursor.png|300px|left|Figure 2. Palmitic acid is a common fatty acid found in plants and animals. This metabolite is the precursor of our pheromone. ]] | ||
| + | <html> | ||
| + | <p style="text-align: justify; font-style: italic; font-size: 0.8em; width: 700px;"><span class="black-bold">Figure 2</span>. Palmitic acid is a common fatty acid in plants and animals. This metabolite is the precursor of our | ||
| + | |||
| + | pheromone.</p> | ||
| + | <br/> | ||
| + | <br/> | ||
| + | <p> | ||
| + | <b>Palmitic acid (16:0)</b> is the most common fatty acid (saturated) found in animals, plants and microorganisms. </p> | ||
| + | <p> | ||
| + | Acetyl-CoA carboxylase (acc) catalyzes the carboxilation of acetyl-CoA to produce malonyl-CoA. The last one substrate triggers the biosynthesis of Palmitic acid and produce the Hexadecanoic acid_acc. | ||
| + | <br/> | ||
| + | As precursor of our pathway, our | ||
| + | efforts were aimed at the optimization of <b>palmitic acid</b>. In the AraGEM model, this is denoted as <b>Hexadecanoic acid_acc (16:0)</b> and is located in the cytosol (see Figure 2). To model the pathway, we combined the new reaction | ||
| + | |||
| + | EXZ11 with one influx V<sub>1</sub> and two effluxes V<sub>2</sub>, V<sub>3</sub> (see Figure 1). The efflux V<sub>3</sub> was incorporated as an exchange reaction, in order to generate a branch in the original pathway of 16:0 | ||
| + | |||
| + | metabolism. As our metabolic pathway is linear, starting from 16:0, this new added branch represents the whole synthetic pathway of our pheromone.</p> | ||
| + | <br/> | ||
| + | <br/> | ||
| + | <br/> | ||
| + | <br/> | ||
| + | |||
| + | <p> | ||
| + | <h3>Defining scenarios</h3><br/> | ||
| + | <p>AraGEM is capable of representing both photosynthetic and nonphotosynthetic cell types [1]. In order to reproduce the classical physiological scenarios of plant cell metabolism, we explored two photosynthetic scenarios: i) | ||
| + | |||
| + | Photosynthesis and ii) Photorespiration. The difference comes from the <span class="black-bold">carboxylation reaction of rubisco</span>. This enzyme, in the presence of oxygen, reduces the energy efficiency of photosynthetic output | ||
| + | |||
| + | by 25% in C<sub>3</sub> plants.<p> | ||
| + | <br/> | ||
| + | |||
| + | </html> | ||
| + | [[File:Sexy_ribusco.png|700px|center|Figure 3. Rubisco enzyme action defines two scenarios in plant metabolism: Photosynthesis and Photorespiration. During Photosynthesis, the carboxylation-oxygenation ratio is +1:0 and there is no | ||
| + | |||
| + | oxygenation of ribulose 1.5-bisP. Moreover, the presence of oxygen and rubisco also catalyzes an oxygen reaction, photosynthesis efficiency is reduced and the carboxylation-oxygenation ratio is +3:1.]]<html> | ||
| + | |||
| + | <p style="text-align: justify; font-style: italic; font-size: 0.8em; width: 700px;"><span class="black-bold">Figure 3</span>. The action of the rubisco enzyme defines two scenarios in plant metabolism: photosynthesis, and | ||
| + | |||
| + | photorespiration. During photosynthesis, the carboxylation-oxygenation ratio is +1:0 and there is no oxygenation of ribulose 1.5-bisP. Moreover, the presence of oxygen and rubisco also catalyzes an oxygen reaction, photosynthesis | ||
| + | |||
| + | efficiency is reduced, and the carboxylation-oxygenation ratio is +3:1.</p> | ||
| + | <br/> | ||
| + | |||
| + | <h3>Model assumptions</h3> | ||
| + | <p>In plants, most genome-scale metabolic network reconstructions minimize the photons consumption (Ex16) while growth rate or biomass (BIO_L) rate is kept fixed. This is true if we mainly seek the survival of the plant. In such a | ||
| + | |||
| + | case, photons consumption will be the optimization objective.</p> | ||
| + | <br/> | ||
| + | <p>In our case, the principal objective is maximizing the pheromone production. In other words, optimizing the efflux V<sub>3</sub> (see Figure 2) from the exchange reaction ExZ11. In addition, we must introduce the lower (lb) and | ||
| + | |||
| + | upper (ub) bounds for each reaction. The bounds for the flux reactions Ex16, BIO_L and ExZ11 were fitted according to Table 1.</p> | ||
| + | <br/> | ||
| + | </html> | ||
| + | [[File:Tabla1.png|600px|center|Table 1.]]<html> | ||
| + | <br/> | ||
| + | <p style="text-align: justify; font-style: italic; font-size: 0.8em; width: 700px;"><span class="black-bold">Table 1</span>. Upper and lower flux bounds in the AraGEM model.</p> | ||
| + | <br/> | ||
| + | <br/> | ||
| + | |||
| + | <h3>Optimal pheromone production using FBA </h3> | ||
| + | <br/> | ||
| + | <p>The optimum flux distribution is defined as the flux distribution that maximizes palmitic acid flux, for a fixed rate of biomass synthesis, and free photon uptake.</p> | ||
| + | <br/> | ||
| + | </html> | ||
| + | [[File:Tabla2.png|600px|center|Table 2.]]<html> | ||
| + | <br/> | ||
| + | <p style="text-align: justify; font-style: italic; font-size: 0.8em; width: 700px;"><span class="black-bold">Table 2</span>. FBA results for each scenario.</p> | ||
| + | <br/> | ||
| + | <p> | ||
| + | The metabolic contrast between photosynthesis and photorespiration is illustrated in Figure 4. In addition, these scenarios need a minimum value of photons uptake, this is evident since the plant needs light to survive. During | ||
| + | |||
| + | photosynthesis (Figure 4A and 4B) we see an increase of the palmitic acid exchange flux when the photons uptake is unconstrained (actually allowing it to reach the default maximum flux in COBRA, i.e. 1000). </p> | ||
| + | <br/> | ||
| + | <p>Even when the photons flux increases freely, most palmitic acid is used for plant growth. Therefore, the new palmitic acid exchange flux only becomes 5.33 [arbitray units] (see Table 2). However, this low level is somehow forced | ||
| + | |||
| + | by the high growth rate that was fixed according to the few existing literature references.</p> | ||
| + | |||
| + | </html> | ||
| + | [[File:FBA optimization.png|600px|center|Figure 4. Optimization during photosynthesis with two different objectives fluxes A) minimizing photons uptake and B) maximizing palmitic acid exchange. During photorespiration, metabolism | ||
| + | |||
| + | products decrease, such as C) photons uptake and D) palmitic acid exchange .]]<html> | ||
| + | |||
| + | <p style="text-align: justify; font-style: italic; font-size: 0.8em; width: 700px;"><span class="black-bold">Figure 4</span>. Optimization during photosynthesis with two different objectives fluxes A) minimizing photons uptake and B) | ||
| + | |||
| + | maximizing palmitic acid exchange. During photorespiration, metabolism products decrease, such as C) photons uptake and D) palmitic acid exchange.</p> | ||
| + | |||
| + | <br/> | ||
| + | <br/> | ||
| + | |||
| + | <p>During photorespiration, we used FBA to optimize and analyze both palmitic acid exchange, and photons uptake. Figure 4C and 4D show an imperceptible loss (2%) in the palmitic acid exchange flux. The new flux is 5.24 [arbitrary | ||
| + | |||
| + | units], similar to the one obtained in the photosynthesis scenario.</p> | ||
| + | <p> | ||
| + | <br/> | ||
| + | At Figures 5 and 6 two objectives have been used: one biological objective (biomass production) and one design objective (palmitic acid production). As can be seen at Figure 5 production of palmitic acid decreases when growth increases | ||
| + | |||
| + | and both are greater when photon uptake raises. Greater photon input implies more energy available for both biomass and palmitic acid production resulting in greater maximum fluxes at these reactions. The inverse behaviour observed | ||
| + | |||
| + | between both objectives is caused by competition for the energy from photons. | ||
| + | </p> | ||
| + | </html> | ||
| + | [[File:VUPV_ProductionMaria.png|850px|center|Figure 5. Growth rate (biological objective) and and palmitic acid production (design objective) versus photon uptake (energy source). Arbitrary flux units are used.]]<html> | ||
| + | <p style="text-align: justify; font-style: italic; font-size: 0.8em; width: 700px;"><span class="black-bold">Figure 5</span>. Growth rate (biological objective) and and palmitic acid production (design objective) versus photon uptake | ||
| + | |||
| + | (energy source). Arbitrary flux units are used.</p> | ||
| + | |||
| + | <br/> | ||
| + | <p> | ||
| + | Figure 6 illustrates coupled productivity of biomass and palmitic acid at different photon input rates. Although biomass and palmitic acid production are competitive objectives the trade-off between them can result in maximum coupled | ||
| + | |||
| + | yield. As total palmitic acid production depends on the number of cells able of producing it (total biomass) maximum coupled production can be achieved by combining them. Moreover, the maximum increases exponentially when photon uptake | ||
| + | |||
| + | grows. | ||
| + | </p> | ||
| + | </html> | ||
| + | [[File:VUPV_CoupledMaria.png|800px|center|Figure 6. Coupled productivity yield for both growth and palmitic acid production at different photon uptakes. Arbitrary flux units are used.]]<html> | ||
| + | <p style="text-align: justify; font-style: italic; font-size: 0.8em; width: 700px;"><span class="black-bold">Figure 6</span>. Coupled productivity yield for both growth and palmitic acid production at different photon uptakes. | ||
| + | |||
| + | Arbitrary flux units are used.</p> | ||
| + | |||
| + | <br/> | ||
| + | <br/> | ||
| + | |||
| + | <p>We also performed a supplementary analysis produced using gene knockout. COBRA toolbox was used to knock out genes of the AraGEM model on a one by one basis to optimize the palmitic acid exchange flux. The Figure 7 shows the | ||
| + | |||
| + | maximum palmitic acid exchange flux obtained after gene knockout of each gene. Out of 1404 knocked out genes, both at photosynthesis and photorespiration, the optimal palmitic acid exchange flux decreases in 33 cases, and does not | ||
| + | |||
| + | present improvement in the remaining ones.</p> | ||
| + | <br/> | ||
| + | <br/> | ||
| + | |||
| + | </html> | ||
| + | [[File:VUPV Knokout.png|600px|center|Figure 7. Palmitic acid exchange flux after gene knockout. Out of 1404 genes in the AraGEM model, 33 (pink lines) genes show an influence on the optimal palmitic acid exchange flux.]]<html> | ||
| + | <p style="text-align: justify; font-style: italic; font-size: 0.8em; width: 700px;"><span class="black-bold">Figure 5</span>. Palmitic acid exchange flux after gene knockout. Out of 1404 genes in the AraGEM model, 33 (pink lines) | ||
| + | |||
| + | genes show an influence on the optimal palmitic acid exchange flux.</p> | ||
| + | <br/> | ||
| + | <p align="left"><strong>References</strong></p><br/> | ||
| + | <div style="position: relative; left: 3%; width: 96%;"> | ||
| + | <ol> | ||
| + | <li> Daniel Hyduke, Jan Schellenberger, Richard Que, Ronan Fleming, Ines Thiele, Jeffery Orth, Adam Feist, Daniel Zielinski, Aarash Bordbar, Nathan Lewis, Sorena Rahmanian, Joseph Kang & | ||
| + | |||
| + | Bernhard Palsson. COBRA Toolbox 2.0 Link: http://systemsbiology.ucsd.edu/Downloads/Cobra_Toolbox.</li> | ||
| + | <li> de Oliveira Dal'Molin CG1, Quek LE, Palfreyman RW, Brumbley SM, Nielsen LK. AraGEM, a genome-scale reconstruction of the primary metabolic network in Arabidopsis. NCBI, Plant Physiol. 2010 | ||
| + | |||
| + | Feb;152(2):579-89. doi: 10.1104/pp.109.148817. Epub 2009 Dec 31.</li> | ||
| + | |||
| + | |||
| + | </ol> | ||
| + | |||
</div> | </div> | ||
| Line 69: | Line 307: | ||
<div id="tab4" class="tab"> | <div id="tab4" class="tab"> | ||
<p>Tab #4 content goes here!</p> | <p>Tab #4 content goes here!</p> | ||
| - | <p>Donec pulvinar neque sed semper lacinia. Curabitur lacinia ullamcorper nibh; quis imperdiet velit eleifend ac. Donec blandit mauris eget aliquet lacinia! Donec pulvinar massa interdum risus ornare mollis. In hac habitasse platea dictumst. Ut euismod tempus hendrerit. Morbi ut adipiscing nisi. Etiam rutrum sodales gravida! Aliquam tellus orci, iaculis vel.</p> | + | <p>Donec pulvinar neque sed semper lacinia. Curabitur lacinia ullamcorper nibh; quis imperdiet velit eleifend ac. Donec blandit mauris eget aliquet lacinia! Donec pulvinar massa interdum risus ornare mollis. In hac habitasse |
| + | |||
| + | platea dictumst. Ut euismod tempus hendrerit. Morbi ut adipiscing nisi. Etiam rutrum sodales gravida! Aliquam tellus orci, iaculis vel.</p> | ||
</div> | </div> | ||
| + | |||
</div> | </div> | ||
</div> | </div> | ||
| + | |||
| + | <br/><br/><br/> | ||
| + | <a class="button-content" id="goto-left" align="center" href="https://2014.igem.org/Team:Valencia_UPV/Modeling/overview"><strong>Go to Modeling Overview</strong></a> | ||
| + | <a class="button-content" id="goto-right" align="center" href="https://2014.igem.org/Team:Valencia_UPV/Modeling/diffusion"><strong>Go to Diffusion and Moth Response</strong></a></br></br></br> | ||
| + | |||
</div> | </div> | ||
Latest revision as of 03:51, 18 October 2014
Modeling > Pheromone Production
The Idea
Pheromones production rates can be estimated using constrained-based modeling of metabolic networks.This can be useful to know the amount of pheromone that can be produced by the synthetic plant.
Constraint-based modeling
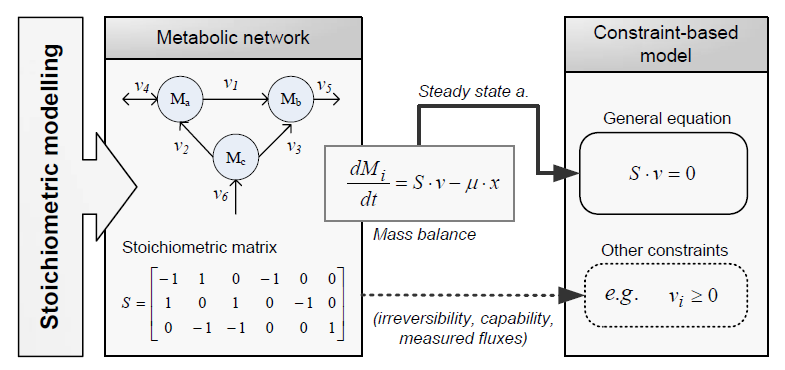
Constraint-based modeling use models of the cell metabolism that are derived from a metabolic network (stoichiometric models) and assume steady-state for the intracellular metabolites. These two constraints are the base of constraint- based modeling: the fact that cells are subject to constraints that limit their behaviour [1]. In principle, if all constraints operating under a given set of circumstances were known, the actual state of a metabolic network could be elucidated. So by imposing the known constraints, it is possible to determine which functional states can and cannot be achieved by a cell.
Types of contraints
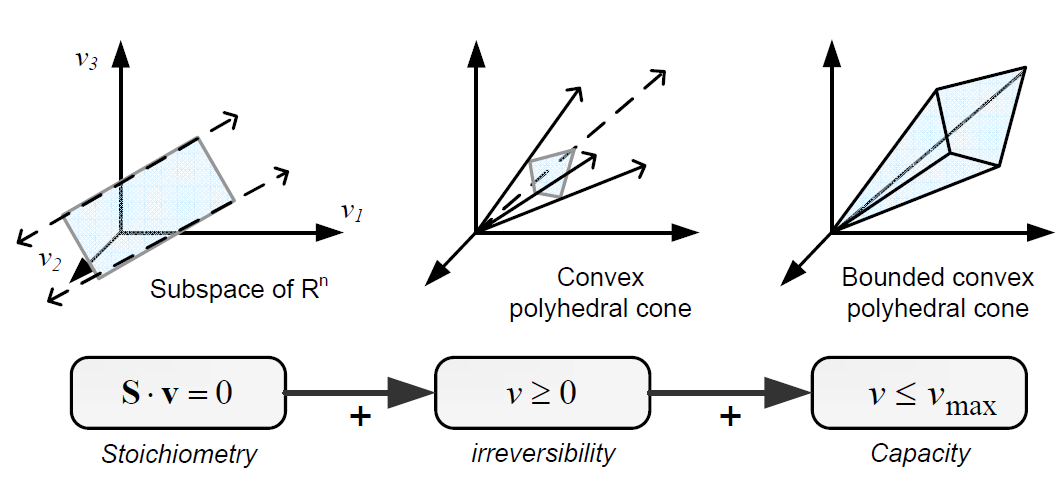
Constraints can be divided in two main types: non adjustable (invariant) and adjustable ones. The former are time-invariant restrictions of possible cell behaviour, whereas the latter depend on environmental conditions, may change through evolution, and may vary from one individual cell to another. Examples of non adjustable constraints are those imposed by thermodynamics (e.g, irreversibility of fluxes) and enzyme or transport capacities (e.g, maximum flux values). Enzyme kinetics, regulation, and experimental measurements are examples of adjustable constraints. To study the invariant properties of a network, only invariant constraints can be used, because they are those that are always satisfied (i.e, they limit the cell capabilities). If adjustable constraints are used, the elucidated cell states will be only valid under the particular set of circumstances in which these constraints operate [2].
Flux Balance Analysis
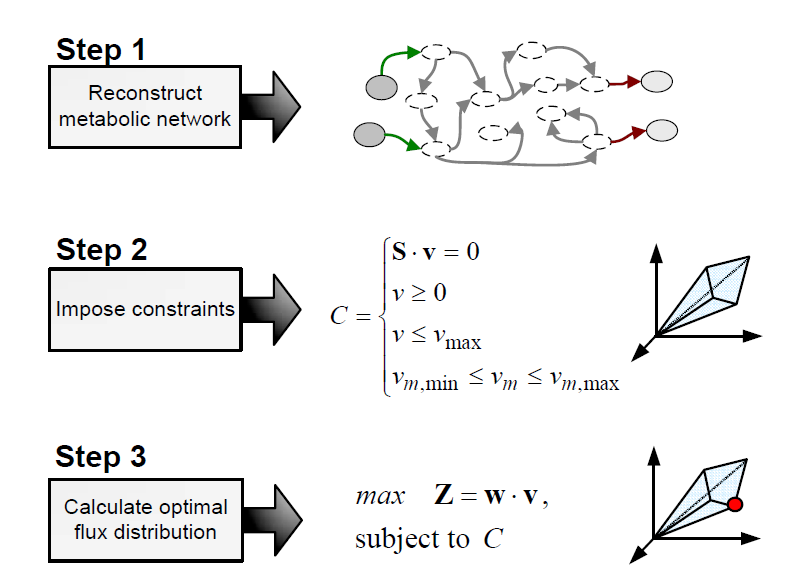
Flux balance analysis (FBA) is a methodology that uses optimisation to get predictions from a constraint-based model by invoking an assumption of optimal cell behaviour. Basically, one particular state among those that cells can show, accordingly to a constraint-based model, is chosen based on the assumption that cells have evolved to be optimal, i.e., that cells regulate its fluxes toward optimal flux states. The following procedure is used to develop a flux balance analysis model:
Flux balance analysis is used to investigate hypothesis (e.g., test if a reduced uptake capacity can be the cause of an unexpected cell behaviour) and to evaluate a range of possibilities (e.g, find the best combination of substrates).
Metabolic objectives and optimization
It must be taken into account that FBA predictions, the optimal flux state, may not correspond to the actual fluxes exhibited by cells. To support the assumption of optimal behaviour, it must be hypothesised that: (i) cells, forced by evolutionary pressure, evolved to achieve an optimal behaviour with respect to certain objective, (ii) we know which this objective is, and (iii) the objective can be expressed, at least approximately, in convenient mathematical terms.
Clearly, predictions of flux balance analysis are dependent on the objective function being used. To date, the most commonly used objective function has been the maximisation of biomass, which leaded to predictions consistent with experimental data for different organisms, such as Escherichia coli [3].
Genome-scale and plant models
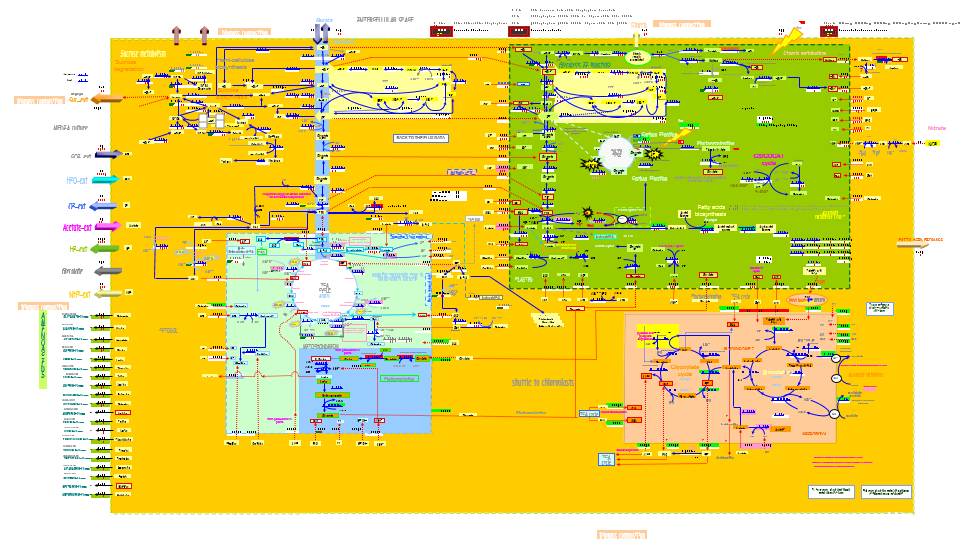
FBA is widely used for predicting metabolism, in particular the genome-scale metabolic network reconstructions that have been built in the past decade. These reconstructions contain all of the known metabolic reactions in an organism, and the genes that encode each enzyme. In our case, FBA will calculate the flow of metabolites through our metabolic network to obtain the maximum production of pheromone. It must be noted that plant genome-scale models are very rare and, indeed, plant FBA is a very new research topic. One of the very few available plant models is the AraGEM model [4], a genome-scale of Arabidopsis Thaliana.
References
- Palsson BO (2006). Systems biology: properties of reconstructed networks. New York, USA: Cambridge University Press New York.
- Llaneras F, Picó J (2008). Stoichiometric Modelling of Cell Metabolism. Journal of Bioscience and Bioengineering, 105:1.
- Edwards JS, Covert M, Palsson B (2002). Metabolic modelling of microbes: the flux-balance approach. Environmental Microbiology, 4:133-140.
- de Oliveira Dal'Molin CG1, Quek LE, Palfreyman RW, Brumbley SM, Nielsen LK. AraGEM, a genome-scale reconstruction of the primary metabolic network in Arabidopsis. NCBI, Plant Physiol. 2010 Feb;152(2):579-89. doi: 10.1104/pp.109.148817. Epub 2009 Dec 31.
COBRA
The COnstraints Based Reconstruction and Analysis (COBRA) approach to systems biology accepts the fact that we do not possess sufficiently detailed parameter data to precisely model, in the biophysical sense, an organism or plant at the genome scale [1]. The COBRA Toolbox is a freely available Matlab toolbox can be used to perform a variety of COBRA methods, including many FBA-based methods. Models for the COBRA Toolbox are saved in the Systems Biology Markup Language (SBML).
AraGEM Model
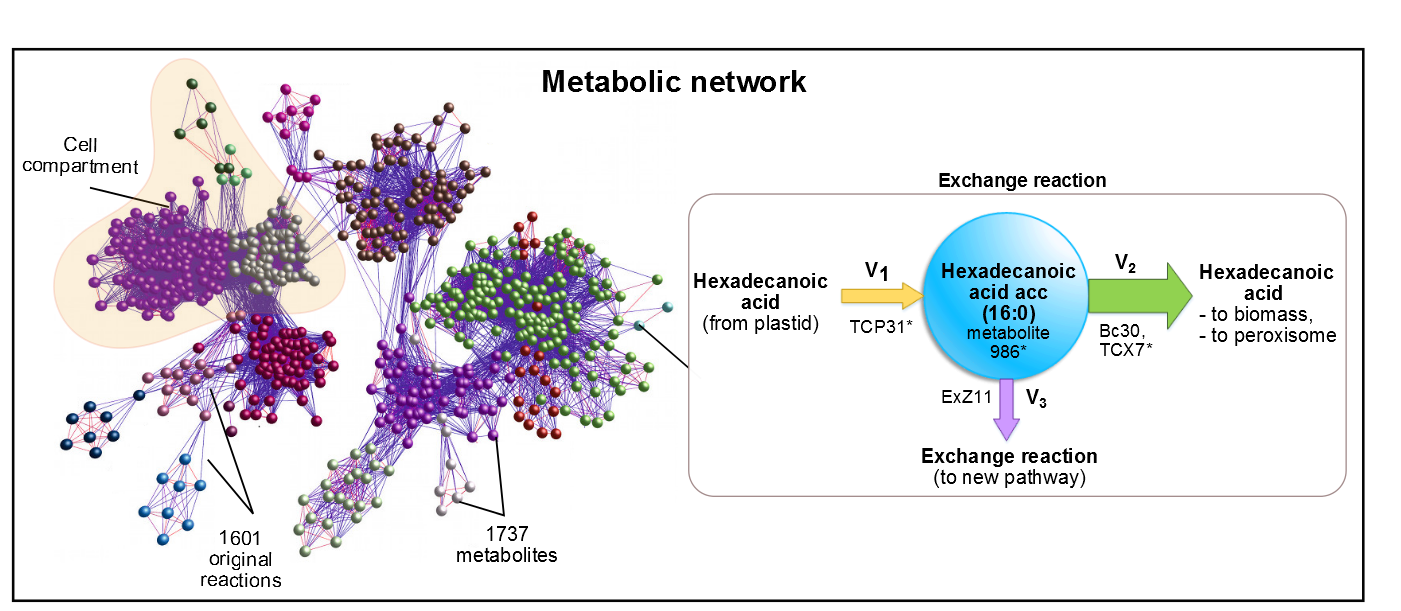
AraGEM [2] is the genome-scale metabolic network model covering primary metabolism for a compartmentalized plant cell based on the Arabidopsis (Arabidopsis Thaliana) genome. AraGEM is a comprehensive literature-based model, that accounts for the functions of 1,419 unique open reading frames, 1,737 metabolites, 5,253 gene-enzyme reaction-association entries, and 1,601 unique reactions compartmentalized into the cytoplasm, mitochondrion, plastid, peroxisome, and vacuole. Using efficient resource utilization as the optimality criterion, AraGEM has already been used to predict the classical photorespiratory cycle as well as known key differences between redox metabolism in photosynthetic and nonphotosynthetic plant cells.
Figure 1. In AraGEM, palmitic acid is also called Hexadecanoic Acid_acc. The reaction added ExZ11 produces the efflux V3 known as palmitic acid exchange.
AraGEM is a viable framework for in silico functional analysis and can be used to derive new, nontrivial hypotheses for exploring plant metabolism. We take for granted that AraGEM is the genome-scale metabolic network model that currently better approximates the metabolism model of N. benthamiana. In Sexy Plant we have added in silico the reactions from the network of pheromone production. As optimality criterion we sought to maximize the pheromone flux produced by the plant.
Pheromone pathway location
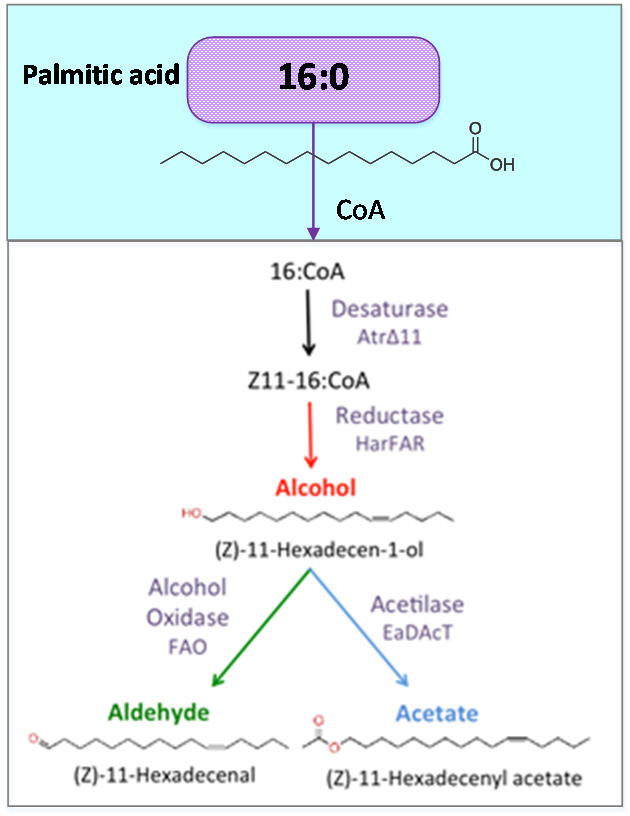
Figure 2. Palmitic acid is a common fatty acid in plants and animals. This metabolite is the precursor of our pheromone.
Palmitic acid (16:0) is the most common fatty acid (saturated) found in animals, plants and microorganisms.
Acetyl-CoA carboxylase (acc) catalyzes the carboxilation of acetyl-CoA to produce malonyl-CoA. The last one substrate triggers the biosynthesis of Palmitic acid and produce the Hexadecanoic acid_acc.
As precursor of our pathway, our
efforts were aimed at the optimization of palmitic acid. In the AraGEM model, this is denoted as Hexadecanoic acid_acc (16:0) and is located in the cytosol (see Figure 2). To model the pathway, we combined the new reaction
EXZ11 with one influx V1 and two effluxes V2, V3 (see Figure 1). The efflux V3 was incorporated as an exchange reaction, in order to generate a branch in the original pathway of 16:0
metabolism. As our metabolic pathway is linear, starting from 16:0, this new added branch represents the whole synthetic pathway of our pheromone.
Defining scenarios
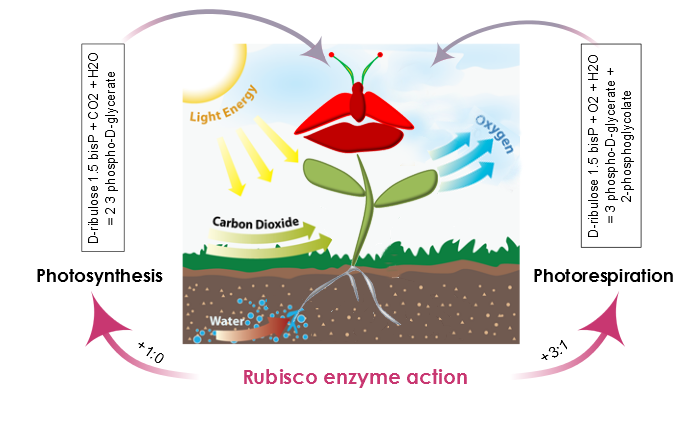
AraGEM is capable of representing both photosynthetic and nonphotosynthetic cell types [1]. In order to reproduce the classical physiological scenarios of plant cell metabolism, we explored two photosynthetic scenarios: i) Photosynthesis and ii) Photorespiration. The difference comes from the carboxylation reaction of rubisco. This enzyme, in the presence of oxygen, reduces the energy efficiency of photosynthetic output by 25% in C3 plants.
Figure 3. The action of the rubisco enzyme defines two scenarios in plant metabolism: photosynthesis, and photorespiration. During photosynthesis, the carboxylation-oxygenation ratio is +1:0 and there is no oxygenation of ribulose 1.5-bisP. Moreover, the presence of oxygen and rubisco also catalyzes an oxygen reaction, photosynthesis efficiency is reduced, and the carboxylation-oxygenation ratio is +3:1.
Model assumptions
In plants, most genome-scale metabolic network reconstructions minimize the photons consumption (Ex16) while growth rate or biomass (BIO_L) rate is kept fixed. This is true if we mainly seek the survival of the plant. In such a case, photons consumption will be the optimization objective.
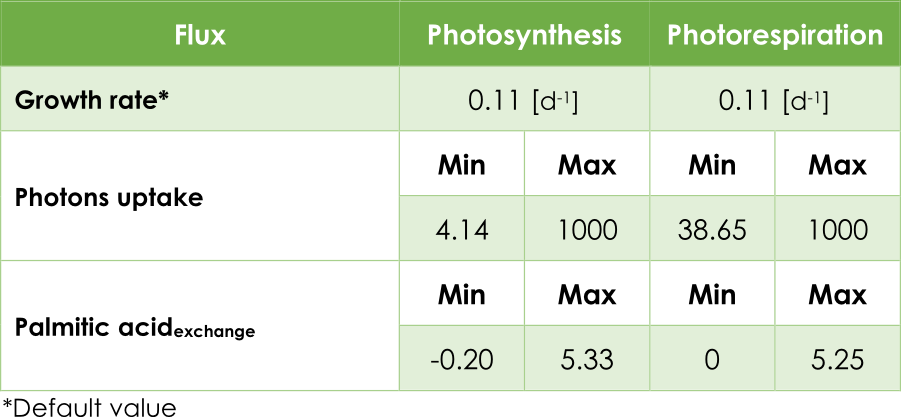
In our case, the principal objective is maximizing the pheromone production. In other words, optimizing the efflux V3 (see Figure 2) from the exchange reaction ExZ11. In addition, we must introduce the lower (lb) and upper (ub) bounds for each reaction. The bounds for the flux reactions Ex16, BIO_L and ExZ11 were fitted according to Table 1.
Table 1. Upper and lower flux bounds in the AraGEM model.
Optimal pheromone production using FBA
The optimum flux distribution is defined as the flux distribution that maximizes palmitic acid flux, for a fixed rate of biomass synthesis, and free photon uptake.
Table 2. FBA results for each scenario.
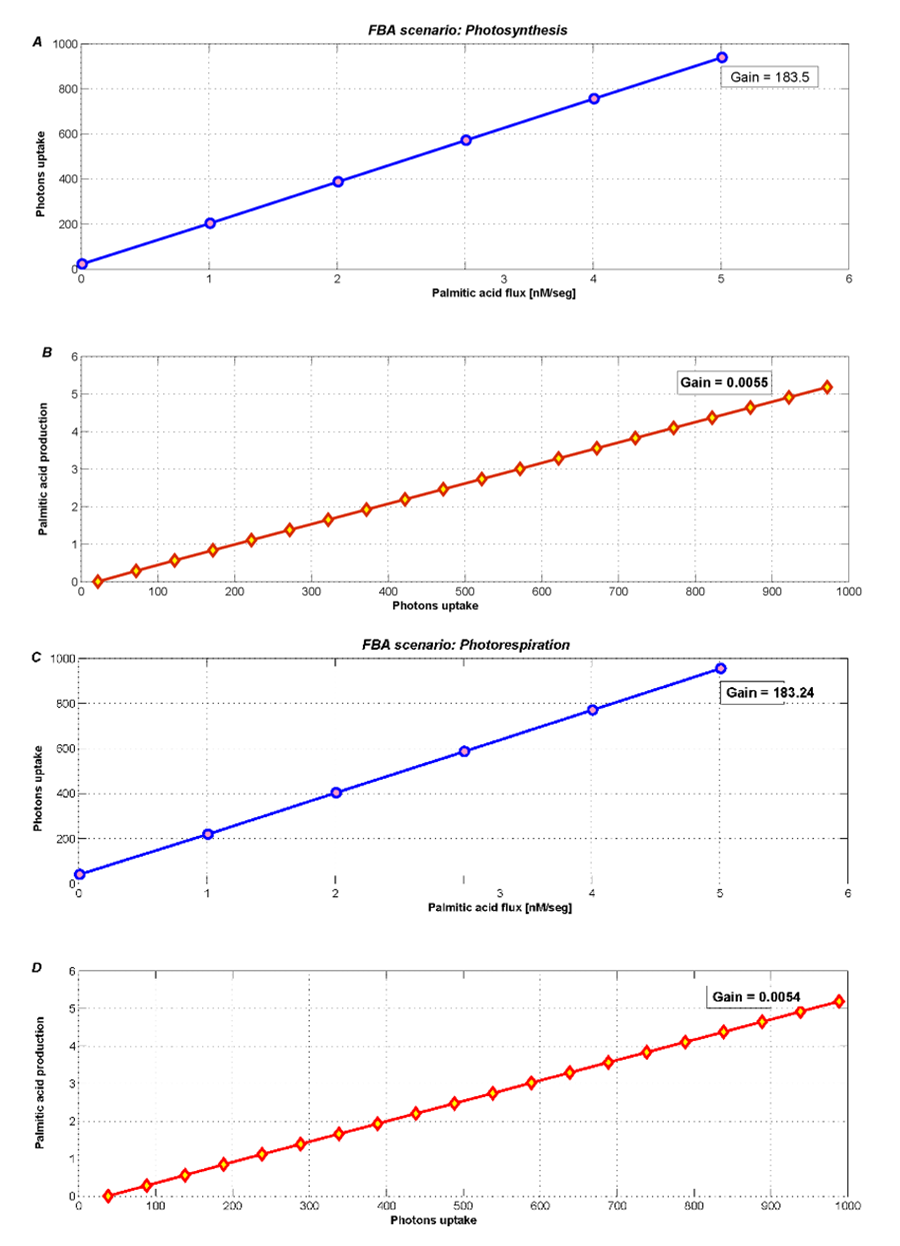
The metabolic contrast between photosynthesis and photorespiration is illustrated in Figure 4. In addition, these scenarios need a minimum value of photons uptake, this is evident since the plant needs light to survive. During photosynthesis (Figure 4A and 4B) we see an increase of the palmitic acid exchange flux when the photons uptake is unconstrained (actually allowing it to reach the default maximum flux in COBRA, i.e. 1000).
Even when the photons flux increases freely, most palmitic acid is used for plant growth. Therefore, the new palmitic acid exchange flux only becomes 5.33 [arbitray units] (see Table 2). However, this low level is somehow forced by the high growth rate that was fixed according to the few existing literature references.
Figure 4. Optimization during photosynthesis with two different objectives fluxes A) minimizing photons uptake and B) maximizing palmitic acid exchange. During photorespiration, metabolism products decrease, such as C) photons uptake and D) palmitic acid exchange.
During photorespiration, we used FBA to optimize and analyze both palmitic acid exchange, and photons uptake. Figure 4C and 4D show an imperceptible loss (2%) in the palmitic acid exchange flux. The new flux is 5.24 [arbitrary units], similar to the one obtained in the photosynthesis scenario.
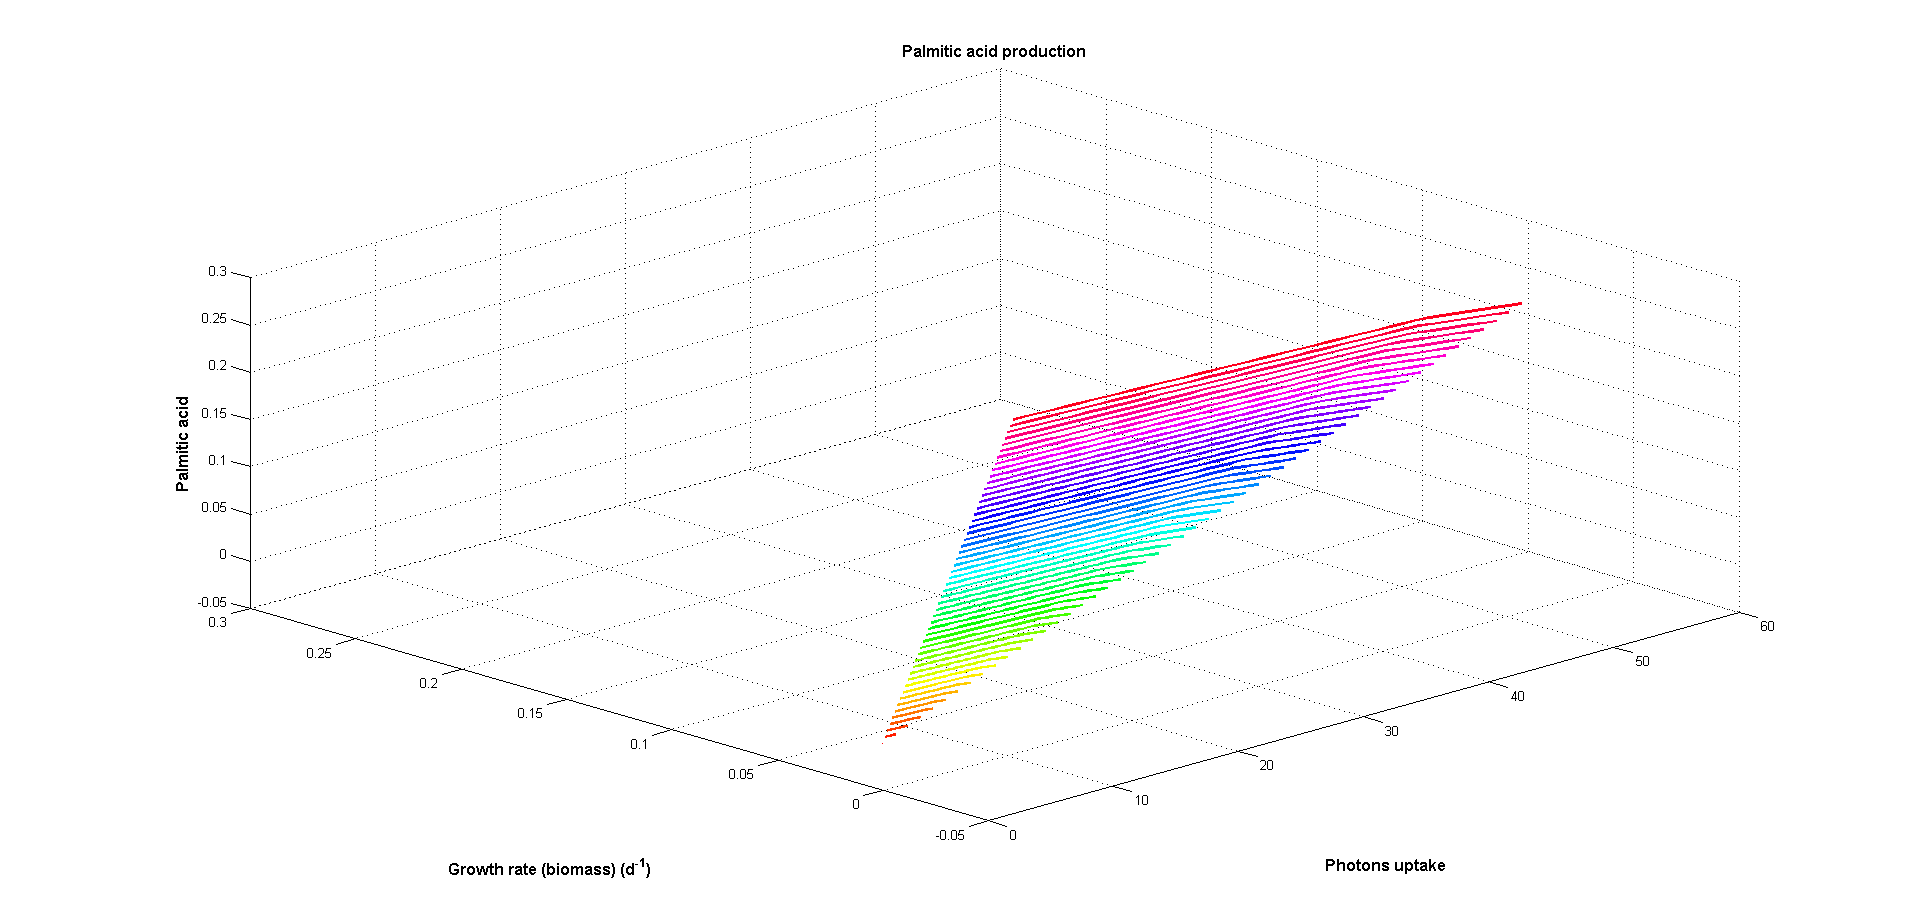
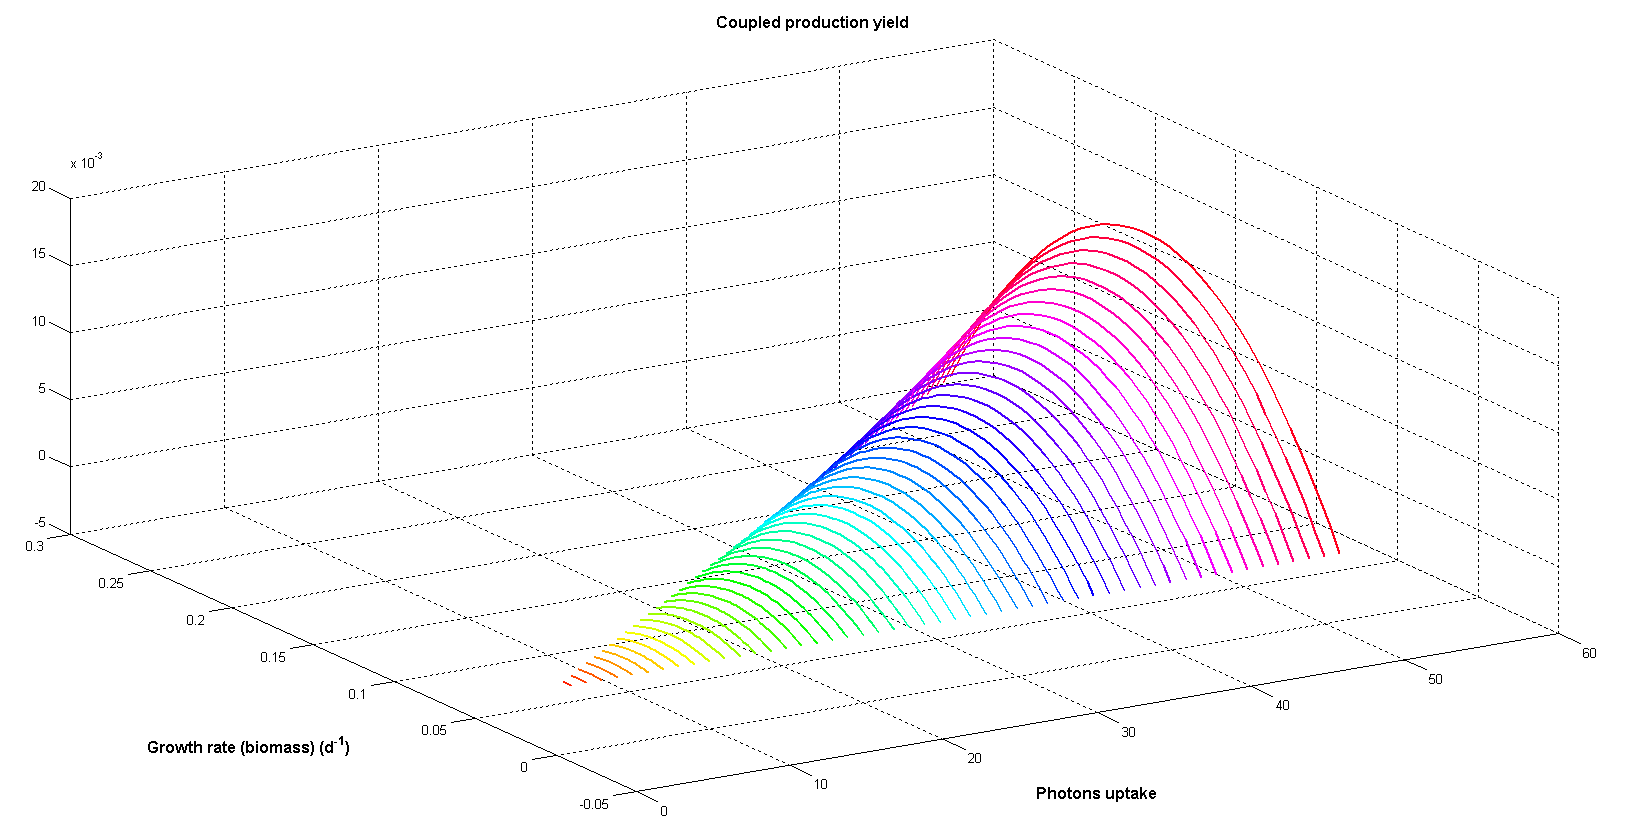
At Figures 5 and 6 two objectives have been used: one biological objective (biomass production) and one design objective (palmitic acid production). As can be seen at Figure 5 production of palmitic acid decreases when growth increases
and both are greater when photon uptake raises. Greater photon input implies more energy available for both biomass and palmitic acid production resulting in greater maximum fluxes at these reactions. The inverse behaviour observed
between both objectives is caused by competition for the energy from photons.
Figure 5. Growth rate (biological objective) and and palmitic acid production (design objective) versus photon uptake (energy source). Arbitrary flux units are used.
Figure 6 illustrates coupled productivity of biomass and palmitic acid at different photon input rates. Although biomass and palmitic acid production are competitive objectives the trade-off between them can result in maximum coupled yield. As total palmitic acid production depends on the number of cells able of producing it (total biomass) maximum coupled production can be achieved by combining them. Moreover, the maximum increases exponentially when photon uptake grows.
Figure 6. Coupled productivity yield for both growth and palmitic acid production at different photon uptakes. Arbitrary flux units are used.
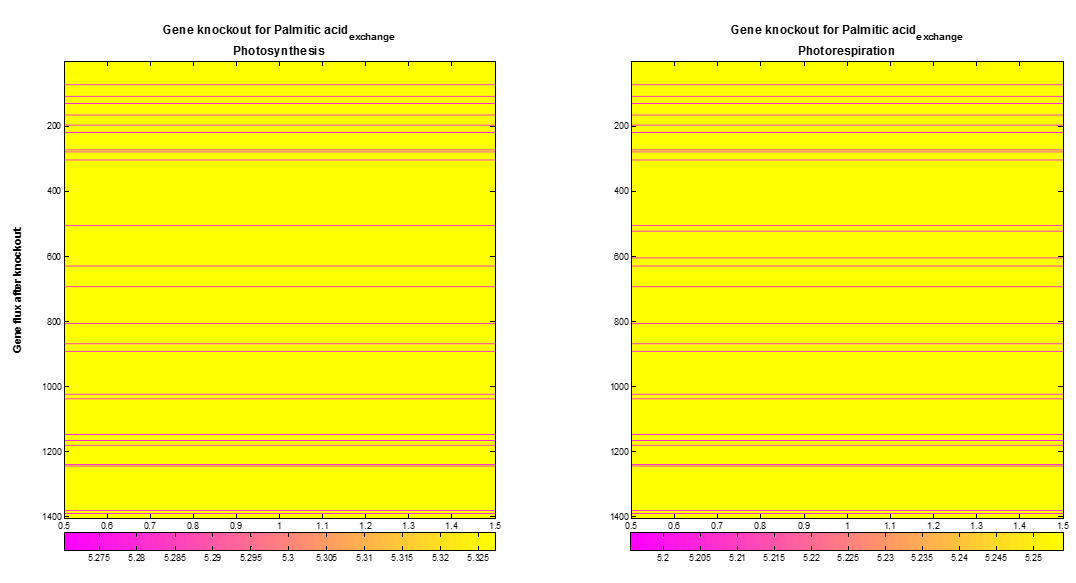
We also performed a supplementary analysis produced using gene knockout. COBRA toolbox was used to knock out genes of the AraGEM model on a one by one basis to optimize the palmitic acid exchange flux. The Figure 7 shows the maximum palmitic acid exchange flux obtained after gene knockout of each gene. Out of 1404 knocked out genes, both at photosynthesis and photorespiration, the optimal palmitic acid exchange flux decreases in 33 cases, and does not present improvement in the remaining ones.
Figure 5. Palmitic acid exchange flux after gene knockout. Out of 1404 genes in the AraGEM model, 33 (pink lines) genes show an influence on the optimal palmitic acid exchange flux.
References
- Daniel Hyduke, Jan Schellenberger, Richard Que, Ronan Fleming, Ines Thiele, Jeffery Orth, Adam Feist, Daniel Zielinski, Aarash Bordbar, Nathan Lewis, Sorena Rahmanian, Joseph Kang & Bernhard Palsson. COBRA Toolbox 2.0 Link: http://systemsbiology.ucsd.edu/Downloads/Cobra_Toolbox.
- de Oliveira Dal'Molin CG1, Quek LE, Palfreyman RW, Brumbley SM, Nielsen LK. AraGEM, a genome-scale reconstruction of the primary metabolic network in Arabidopsis. NCBI, Plant Physiol. 2010 Feb;152(2):579-89. doi: 10.1104/pp.109.148817. Epub 2009 Dec 31.
NetLogo is an agent-based programming language and integrated modeling environment. NetLogo is free and open source software, under a GPL license.
Tab #4 content goes here!
Donec pulvinar neque sed semper lacinia. Curabitur lacinia ullamcorper nibh; quis imperdiet velit eleifend ac. Donec blandit mauris eget aliquet lacinia! Donec pulvinar massa interdum risus ornare mollis. In hac habitasse platea dictumst. Ut euismod tempus hendrerit. Morbi ut adipiscing nisi. Etiam rutrum sodales gravida! Aliquam tellus orci, iaculis vel.
Go to Modeling Overview Go to Diffusion and Moth Response
 "
"
