Team:Aachen/OD/F device

From 2014.igem.org

(Difference between revisions)
(Getting your Device)
(Achievements)
 
(193 intermediate revisions not shown)
Line 1: Line 1:
__NOTOC__
__NOTOC__
 +
{{CSS/Main}}
 +
{{Team:Aachen/Stylesheet}}
{{Team:Aachen/Header}}
-
= OD/F device =
+
= OD/F Device =
-
Measuring Optical Density (OD) is a central element in microbiological work and synthetic biology in general. Often the qeustion is, how many cells are in a suspension. The OD can give you a hint.
+
Measuring '''Optical Density''' (OD) or absorbance is one of the indispensable elements in the field of microbiology. One question that has to be answered often is '''how many cells are in a suspension'''? Here, the OD can give a hint. However, the commercially available [http://www.laboratory-equipment.com/laboratory-equipment/cell-density-meter.php OD meters] are expensive and limit its application and usage in low budget institutions.
-
Commercial OD meters cost several hundred dollars ([http://www.laboratory-equipment.com/laboratory-equipment/cell-density-meter.php OD meter]), and can limit the spread of synthetic biology.
+
Therefore, here we present our OD/F Device. The device is specifically designed for biohackspaces, Do It Yourself (DIY), community laboratories and schools. With our OD/F Device, we aim to enable precise and inexpensive scientific research.
-
Especially for BioHack-Spaces, DIY laboratories and schools we wanted to develop an alternative.
+
-
With our OD/F device we want to enable many to people for good, precise and cheap science.
+
Further, in Synthetic Biology, the task of measuring OD and fluorescence are often performed at the same time. Hence, here we present a device that can be configured to '''simultaneously measure both fluorescence and OD'''. With such a configuration of the OD/F Device, the production of fluorescence signal can be correlated to cell growth using a single and a portable device.
-
Especially for the [[Interlab Study]] also fluorescence has been of importance. Here the correlation between OD and fluorescence should be measured.
+
<html>
-
Since the taks of measuring OD and fluorescence are often performed at the same time, we want to present a device that can measure both with easy changes. Finally we can tell you, how much fluorescence there is per amount of cells.
+
<center>
 +
<ul class="menusmall-grid">
 +
<!-- Overview -->
-
In fact, you can find some DIY posts for turbidity meters such as [http://www.thingiverse.com/thing:74415 Turbidity sensors]. However a proper assessment of their linearity as well as a calculated OD-value is missing.
+
  <li>
 +
    <a class="menulink" href="https://2014.igem.org/Team:Aachen/OD/F_device#odfmeasuringprinciple" style="color:black">
 +
    <div class="menusmall-item menusmall-info" ><div class="menukachel" style="top:25%; line-height:1.5em;">Measuring Principle</div></div>
 +
    <div class="menusmall-item menusmall-img" style="background: url(https://static.igem.org/mediawiki/2014/0/0f/Aachen_14-10-10_ODF_Button_ipo.png); norepeat scroll 0% 0% transparent; background-size:100%">
 +
    </div>
 +
    </a>
 +
  </li>
-
Also regarding fluorescence, we're not re-inventing the wheel (well, not totally). The 2010 iGEM Cambridge team actually build a very similar device, the [https://2010.igem.org/Team:Cambridge/Tools/Eglometer E.glometer]. However, there's no data available showing an actual comparison of the data from their device, and some proven, commercial system, e.g. to assess linearity of the measurement.
+
  <li>
 +
    <a class="menulink" href="https://2014.igem.org/Team:Aachen/OD/F_device#odfapplication" style="color:black">
 +
    <div class="menusmall-item menusmall-info" ><div class="menukachel" style="top:35%; line-height:1.5em;">Application</div></div>
 +
    <div class="menusmall-item menusmall-img" style="background: url(https://static.igem.org/mediawiki/2014/5/55/Aachen_17-10-14_Glowing_cuvette-ipo.png); norepeat scroll 0% 0% transparent; background-size:100%">
 +
    </div>
 +
    </a>
 +
  </li>
-
== Development ==
+
<li>
 +
    <a class="menulink" href="https://2014.igem.org/Team:Aachen/OD/F_device#odfachievements" style="color:black">
 +
    <div class="menusmall-item menusmall-info" ><div class="menukachel" style="top:25%; line-height:1.5em;">Achieve-<br/>ments</div></div>
 +
    <div class="menusmall-item menusmall-img" style="background: url(https://static.igem.org/mediawiki/2014/e/ef/Aachen_14-10-15_Medal_Cellocks_iNB.png); norepeat scroll 0% 0% transparent; background-size:100%">
 +
    </div>
 +
    </a>
 +
  </li>
-
Developing the OD/F device has been an interesting task. On the one hand, this device has been developed mainly by the computer guys. On the other hand, the biologists affected from color-blindness helped to select the correct filters for the LEDs. Not the best combinations to recommend ;) .
+
<li>
 +
    <a class="menulink" href="https://2014.igem.org/Team:Aachen/OD/F_device#odfoutlook" style="color:black">
 +
    <div class="menusmall-item menusmall-info" ><div class="menukachel" style="top:35%; line-height:1.5em;">Outlook</div></div>
 +
    <div class="menusmall-item menusmall-img" style="background: url(https://static.igem.org/mediawiki/2014/6/67/Aachen_14-10-16_Outlook_Cellocks_iNB.png); norepeat scroll 0% 0% transparent; background-size:100%">
 +
    </div>
 +
    </a>
 +
  </li>
-
Being naive, the computer guys first attached the sensor to the couvette holder at approximately 1.5cm, which was perfectly suited for 3ml cuvettes. However, those are not widely used anymore, and we migrated to 1.6ml cuvettes. As it turns out, if the sensor sits at 1.5cm, it just hits the position where the cuvette enlarges again - and most importantly, where the edge of the sample solution is.
+
</ul>
-
This results in diffraction on the surface of the sample, and finally renders any measurement results into - from a computer scientific point of view - a perfect random number generator.
+
</center>
 +
</html>
-
However, placing the sensor very low brings problems with sedimentation as well as diffractions from the bottom. Finally we place the sensor in 0.75cm height, which, as it turns out later, is very close to one of the standard heights (0.2cm, 0.8cm, 1.2cm) of OD meters.
 
-
The main problem here was also to have the sensor as close to the bottom, such that enough lights shines through for the fluorescence measurement, and to have it closer to the top, such that effects from sedimentation are reduced.
 
-
It is important to note, that despite the minimal fill heights of the 1.6ml cuvettes of 1.2ml, our device also works with fills of only 1ml, which comes closer to reality in the lab.
+
{{Team:Aachen/BlockSeparator}}
-
The final cuvette holder design is rendered below in a stl-file:
+
[[File:Aachen_14-10-10_ODF_Button_ipo.png|right|150px]]
-
<html>
+
== Measuring Principle ==
-
<center>      
+
<span class="anchor" id="odfmeasuringprinciple"></span>
-
<iframe src="https://2014.igem.org/Team:Aachen/Notebook/Engineering/Cuvette3D?action=render
+
 
-
" width=500px height=500px frameBorder="0"></iframe>
+
The measuring principle for both optical density (OD) and fluorescence measurement is shown below. For OD measurement,  the sample is illuminated with an LED and a fixed slit width. A filter blocks any light less than 600 nm. In this way, the sensor mainly senses the 600 nm light which is needed for OD{{sub|600}} measurement.
 +
 
 +
For the fluorescence measurement, a similar approach is followed. The filter, again, is used to block the exciting light from being sensed. In this way, only the emitted light from the fluorescence protein is detected and measured.
 +
 
 +
Further details about selecting filters, code, a construction manual and evaluation can be found [https://2014.igem.org/Team:Aachen/Notebook/Engineering/ODF here].
 +
 
 +
<center>
 +
{{Team:Aachen/Figure|Aachen_odf_schemes.png|title=Measuring principle for OD/F Device|subtitle=The left image shows the measurement approach for the optical density. The light shines through the sample with a fixed width. The right image shows the fluorescence measurement approach, exciting the fluorescence proteins from below and measuring from the side.|width=500px}}
</center>
</center>
-
</html>
+
 
 +
<center>
 +
{{Team:Aachen/Figure|Aachen_ODF_7.JPG|title=The combined OD/F Device for optical density and fluorescence measurement.|subtitle= |width=650px}}
 +
</center>
 +
 
 +
 
{{Team:Aachen/BlockSeparator}}
-
= OD device =
+
[[File:Aachen 17-10-14 Glowing cuvette-ipo.png|right|150px]]
 +
== ''Modus operandi'' of the OD/F Device==
 +
<span class="anchor" id="odfapplication"></span>
-
=== Hint: Building it ===
+
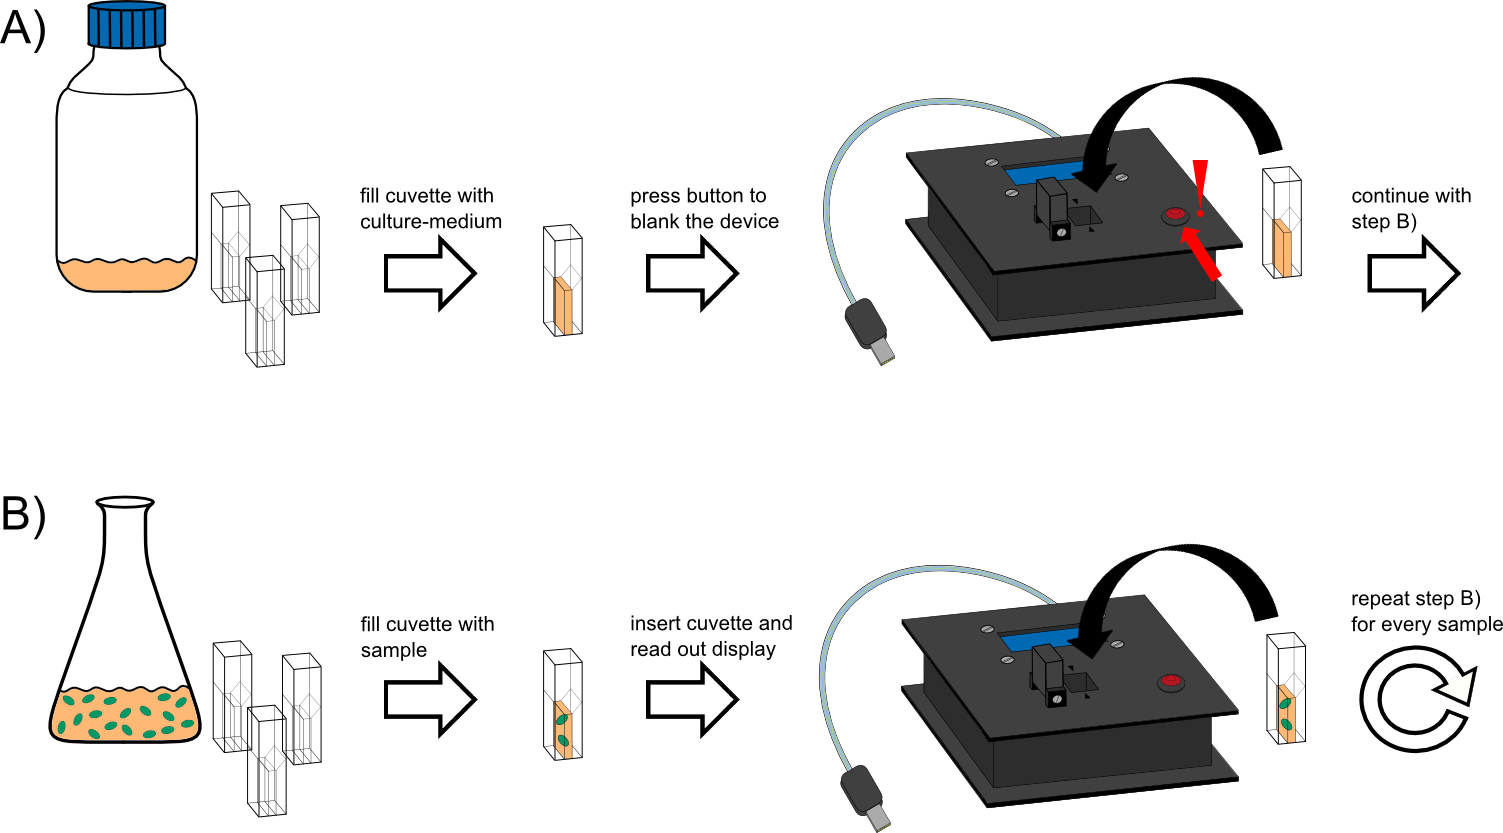
The device is constructed to make it easy-to-handle for the end users. The standard operating procedure to operate and measure optical density or fluorescence is schematically shown in the figure below.
-
{{Team:Aachen/Figure|Aachen ODdevice Steckplatine.png|title=Our novel biosensor approach|subtitle=Expression of the TEV protease is induced by HSL. The protease cleaves the GFP-REACh fusion protein to elecit a fluorescence response.|width=900px}}
+
{{Team:Aachen/Figure|Aachen 14-10-09 Flowsheet OD-device ipo.png|title=|subtitle=|width=1000px}}
-
If you want to build the OD device, make sure to use the following secret ingredients:
 
-
* Filter:
 
-
* LED:
 
{{Team:Aachen/BlockSeparator}}
-
= F device =
+
[[File:Aachen_14-10-15_Medal_Cellocks_iNB.png|right|150px]]
-
=== Hint: Building it ===
+
== Achievements ==
 +
<span class="anchor" id="odfachievements"></span>
-
{{Team:Aachen/Figure|Aachen_Fdevice_Steckplatine.png|title=Our novel biosensor approach|subtitle=Expression of the TEV protease is induced by HSL. The protease cleaves the GFP-REACh fusion protein to elecit a fluorescence response.|width=900px}}
+
When building the OD/F Device, '''our goal''' was to develop a system that
-
If you want to build the OD device, make sure to use the following secret ingredients:
+
-
* Filter:
+
-
* LED:
+
-
{{Team:Aachen/BlockSeparator}}
+
* easy-to-handle and portable
 +
* precise, stable, and reproducible results
 +
* easy to build from Open Source parts
 +
* combined measurement of optical density and fluorescence
 +
* low cost
-
= Getting your Device =
+
Commercially available equipment uses lasers and a set of two fine filters, one between laser and sample and one between sample and sensor. To reduce the cost, our OD/F Device uses a simpler measuring principle: it is designed with one low-cost filter, between sample and sensor, and illuminates with an LED instead of a laser. Nevertheless, one main goal was to produce an inexpensive device. Given that, we therefore had to compromise some of the measurement quality, were we still able to produce stable, precise and good data?
-
While the casing and the cuvette holder are custom made, most of the parts are pre-made and only need to be bought.
+
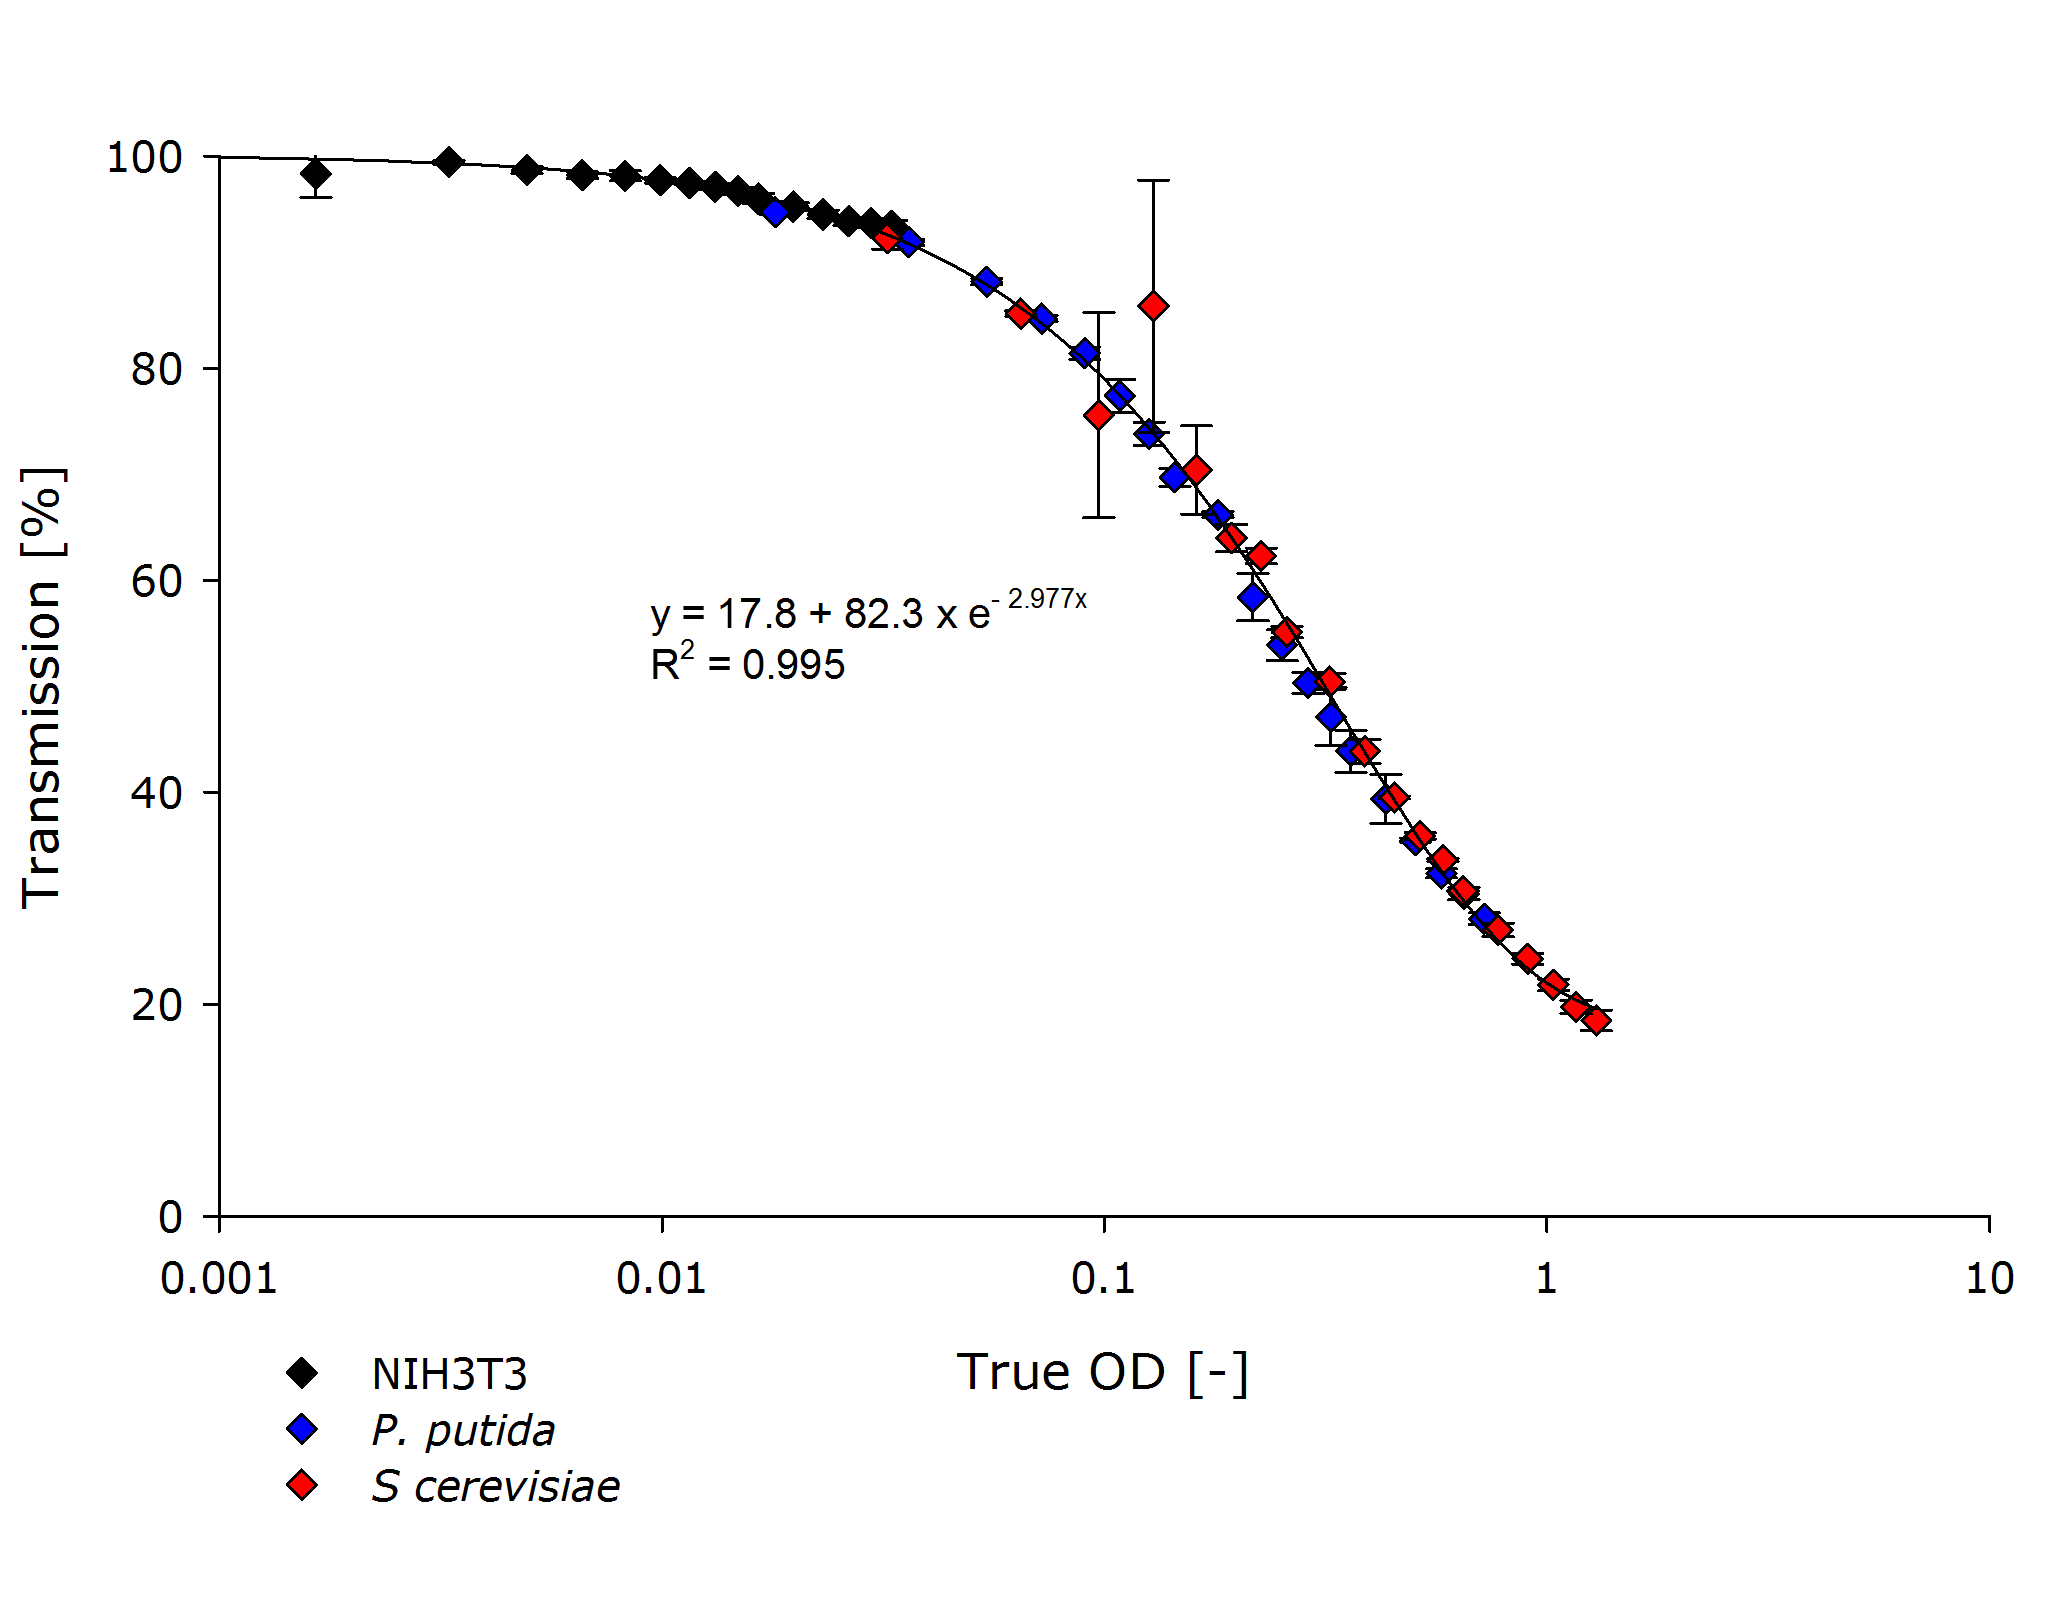
{{Team:Aachen/Figure|Aachen_ODallstrains1.png|title=Transmission of different cell types at OD-values from 0.001-1|subtitle=The transmittance data of NIH&nbsp;3T3 (mouse fibroblasts) cells align with the transmittance of ''P.&nbsp;putida'' and ''S.&nbsp;cerevisiae'' strains, even though the measured optical densities are lower by 1-2 orders of magnitude.|width=800px}}
-
Please find our custom parts for download below, and together with the other parts listed in the table below with additional pricing information.
+
The answer is: Yes! With the optimal design of our cuvette holder we achieved good-quality results albeit using the cheap filter. The transmission to true OD conversion is stable for all cell types as expected.
-
Despite being custom parts, these are quite inenxpensive - so feel free to give our OD/F device a test :) !
+
-
* cuvette holder [https://2014.igem.org/Template:Team:Aachen/cuvette.stl?action=raw stl file download]
+
Have we been re-inventing the wheel? No!
-
* casing
+
In fact, you can find some DIY posts for turbidity meters such as [http://www.thingiverse.com/thing:74415 turbidity sensors]. However, a proper assessment of their linearity as well as a calculated OD-value are missing.
 +
 +
Regarding fluorescence, we are also not re-inventing the wheel. The [https://2010.igem.org/Team:Cambridge 2010 iGEM Cambridge] team actually built a very similar device, the [https://2010.igem.org/Team:Cambridge/Tools/Eglometer E.glometer]. However, there's no data available showing an actual comparison of the data from their device and some proven commercial system to, for example, assess linearity of the measurement.
 +
 
 +
We made a commercial assessment of the OD/F Device that results in a total cost of $60. The unit is built from acrylic glass for the casing. The compact design results in a weight which is less than 200g. The device can be easily connected to any power adapter via USB. The technical details and a construction manual of OD/F Device is [https://2014.igem.org/Team:Aachen/Notebook/Engineering/ODF#diy published] on our engineering page.
-
Table 1: Number of pieces, components and costs for building your own OD/F device
 
-
{| class="wikitable"
 
-
! number of pieces !! components !! costs [$] !! order e.g. from
 
-
|-
 
-
| 1||arduino UNO R3||12.66||
 
-
|-
 
-
| 2||light to frequency sensor TSL 235R||5.90||
 
-
|-
 
-
| 1||display 2x16 l2C||18.97||
 
-
|-
 
-
| 2||LEDs||2.50||
 
-
|-
 
-
| 1||taster||5.23||
 
-
|-
 
-
| 1||filter slide||5.20||
 
-
|-
 
-
| 20||jumper-wire-cable||2.36||
 
-
|-
 
-
| 2||small breadboards||3.00||
 
-
|-
 
-
| 1||power supply||5.00||
 
-
|-
 
-
| 1 ||case||20.24||
 
-
|-
 
-
| 2||cuvettes-holder||15.95||
 
-
|-
 
-
| -||odds and ends like header sockt/pins||2.52||-
 
-
|-
 
-
| -||total||99.53||-
 
-
|}
 
{{Team:Aachen/BlockSeparator}}
-
= Building your own OD/F device =
+
[[File:Aachen_14-10-16_Outlook_Cellocks_iNB.png|right|150px]]
 +
 
 +
== Outlook ==
 +
<span class="anchor" id="odfoutlook"></span>
 +
 
 +
We have proven that our device is capable of delivering good results, even in hard conditions as low cell concentrations.
 +
Yet there is room for improvement.
 +
The calibration process is quite intensive work. An application to do this automatically would help for this process.
 +
For the ease of use and to prevent data loss from noting down measured values manually, a smartphone application that can directly correlate OD and fluorescence values would be a great addition. This addition will be implemented in the next version.
-
{| class="wikitable centered"
 
-
|-
 
-
| [[File:Aachen_ODF_9.JPG|300px]] || First we want to assemble the casing. Once you have all the cut parts, you can start to assemble them. For cutting, we really recommend using a laser cutter.
 
-
|-
 
-
| [[File:Aachen_ODF_8.JPG|300px]] || Attach the cuvette-holder holders such that the cuvette holder is placed directly under the opening hole.
 
-
|-
 
-
| [[File:Aachen_ODF_4.JPG|300px]] || Next build the lid of the device. At this stage you can already mount the button. We recommend to glue any parts.
 
-
|-
 
-
| [[File:Aachen_ODF_3.JPG|300px]] || Your lid finally should look like this.
 
-
|-
 
-
| [[File:Aachen_ODF_11.JPG|150px]][[File:Aachen_ODF_10.JPG|150px]] || Next we want to assemble the cuvette holders. On the side with the square hole attach the light-to-frequency sensor with glue. For the OD case place the orange LED opposite, or for fluorescence, the LED in the hole in the bottom. Make sure to close any remaining open hole!
 
-
|-
 
-
| [[File:Aachen_ODF_12.JPG|300px]] || Your final assembly should then look like this. Now place the correct filter into the cuvette holder, directly in front of the sensor. Make sure that the filter does not degrade due to the glue!
 
-
|-
 
-
| [[File:Aachen_ODF_14.JPG|300px]] || As the case can be used for both, fluorescence and OD measurement, we use a combined plug. Just three header rows (7 pins) and connect them as we did.
 
-
|-
 
-
| [[File:Aachen_ODF_1.JPG|300px]] || Now we're doing the wiring. Connect the Arduino 5V and GND such that you have one 5V and one GND line on your breadboard.
 
-
|-
 
-
| [[File:Aachen_ODF_2.JPG|300px]] || Then connect the button to 5V on the one side, and to GND via a resistor on the other side. Connect this side also to port __ on your Arduino. This will sense the blank. Next connect the display to the Arduino and our connector. See the Fritzing diagram at the bottom for a detailed information.
 
-
|-
 
-
| [[File:Aachen_ODF_13.JPG|300px]] || Now put everything into the case and ...
 
-
|-
 
-
| [[File:Aachen_ODF_6.JPG|300px]] || ... also place the cuvette holder into the device. Attach the display to the device lid and close the casing.
 
-
|-
 
-
| [[File:Aachen_ODF_7.JPG|300px]] || Congratulations! You have finished constructing your own OD/F device!
 
-
|}
 
{{Team:Aachen/Footer}}

Latest revision as of 03:48, 18 October 2014

OD/F Device

Measuring Optical Density (OD) or absorbance is one of the indispensable elements in the field of microbiology. One question that has to be answered often is how many cells are in a suspension? Here, the OD can give a hint. However, the commercially available [http://www.laboratory-equipment.com/laboratory-equipment/cell-density-meter.php OD meters] are expensive and limit its application and usage in low budget institutions.

Therefore, here we present our OD/F Device. The device is specifically designed for biohackspaces, Do It Yourself (DIY), community laboratories and schools. With our OD/F Device, we aim to enable precise and inexpensive scientific research.

Further, in Synthetic Biology, the task of measuring OD and fluorescence are often performed at the same time. Hence, here we present a device that can be configured to simultaneously measure both fluorescence and OD. With such a configuration of the OD/F Device, the production of fluorescence signal can be correlated to cell growth using a single and a portable device.


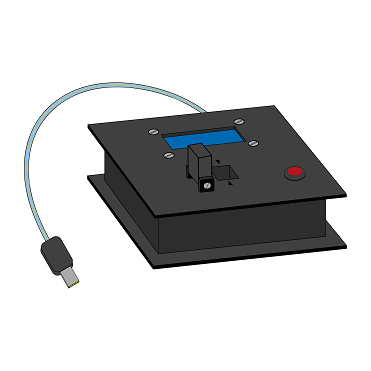
Aachen 14-10-10 ODF Button ipo.png

Measuring Principle

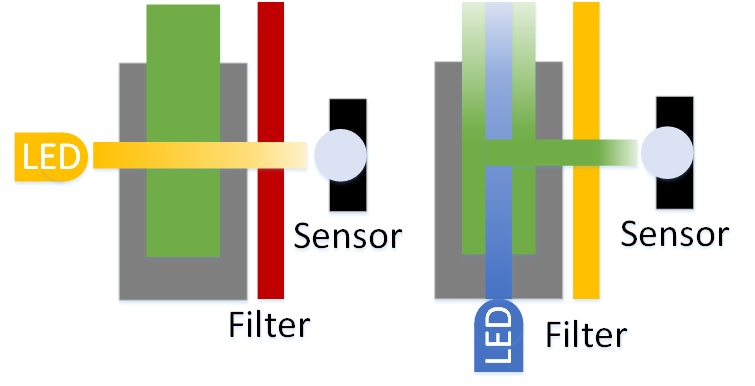
The measuring principle for both optical density (OD) and fluorescence measurement is shown below. For OD measurement, the sample is illuminated with an LED and a fixed slit width. A filter blocks any light less than 600 nm. In this way, the sensor mainly senses the 600 nm light which is needed for OD600 measurement.

For the fluorescence measurement, a similar approach is followed. The filter, again, is used to block the exciting light from being sensed. In this way, only the emitted light from the fluorescence protein is detected and measured.

Further details about selecting filters, code, a construction manual and evaluation can be found here.

Aachen odf schemes.png
Measuring principle for OD/F Device
The left image shows the measurement approach for the optical density. The light shines through the sample with a fixed width. The right image shows the fluorescence measurement approach, exciting the fluorescence proteins from below and measuring from the side.
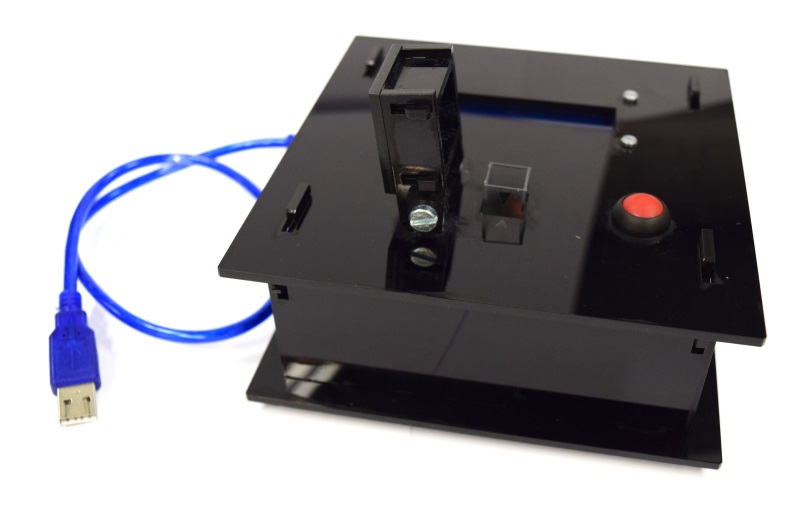
Aachen ODF 7.JPG
The combined OD/F Device for optical density and fluorescence measurement.


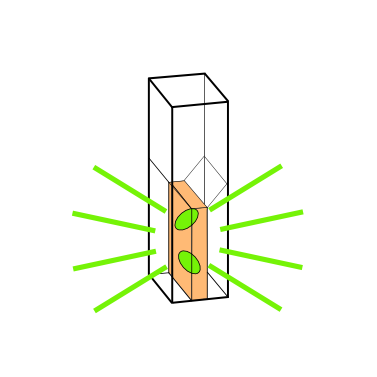
Aachen 17-10-14 Glowing cuvette-ipo.png

Modus operandi of the OD/F Device

The device is constructed to make it easy-to-handle for the end users. The standard operating procedure to operate and measure optical density or fluorescence is schematically shown in the figure below.

Aachen 14-10-09 Flowsheet OD-device ipo.png
'


Aachen 14-10-15 Medal Cellocks iNB.png

Achievements

When building the OD/F Device, our goal was to develop a system that

  • easy-to-handle and portable
  • precise, stable, and reproducible results
  • easy to build from Open Source parts
  • combined measurement of optical density and fluorescence
  • low cost

Commercially available equipment uses lasers and a set of two fine filters, one between laser and sample and one between sample and sensor. To reduce the cost, our OD/F Device uses a simpler measuring principle: it is designed with one low-cost filter, between sample and sensor, and illuminates with an LED instead of a laser. Nevertheless, one main goal was to produce an inexpensive device. Given that, we therefore had to compromise some of the measurement quality, were we still able to produce stable, precise and good data?

Aachen ODallstrains1.png
Transmission of different cell types at OD-values from 0.001-1
The transmittance data of NIH 3T3 (mouse fibroblasts) cells align with the transmittance of P. putida and S. cerevisiae strains, even though the measured optical densities are lower by 1-2 orders of magnitude.

The answer is: Yes! With the optimal design of our cuvette holder we achieved good-quality results albeit using the cheap filter. The transmission to true OD conversion is stable for all cell types as expected.

Have we been re-inventing the wheel? No! In fact, you can find some DIY posts for turbidity meters such as [http://www.thingiverse.com/thing:74415 turbidity sensors]. However, a proper assessment of their linearity as well as a calculated OD-value are missing.

Regarding fluorescence, we are also not re-inventing the wheel. The 2010 iGEM Cambridge team actually built a very similar device, the E.glometer. However, there's no data available showing an actual comparison of the data from their device and some proven commercial system to, for example, assess linearity of the measurement.

We made a commercial assessment of the OD/F Device that results in a total cost of $60. The unit is built from acrylic glass for the casing. The compact design results in a weight which is less than 200g. The device can be easily connected to any power adapter via USB. The technical details and a construction manual of OD/F Device is published on our engineering page.


Aachen 14-10-16 Outlook Cellocks iNB.png

Outlook

We have proven that our device is capable of delivering good results, even in hard conditions as low cell concentrations. Yet there is room for improvement. The calibration process is quite intensive work. An application to do this automatically would help for this process. For the ease of use and to prevent data loss from noting down measured values manually, a smartphone application that can directly correlate OD and fluorescence values would be a great addition. This addition will be implemented in the next version.