 "
"
Team:Toulouse/Modelling
From 2014.igem.org
| Line 125: | Line 125: | ||
<p class="texte"> | <p class="texte"> | ||
| - | Modeling is a tool used to simplify and study systems. | + | Modeling is a tool used to simplify and study systems. It helps us to predict behavior thanks to bibliographic or experimental informations.</br> |
| - | + | The following modelisation focuses on the development of our engineered bacterium (called SubtiTree) in tree. The bacterial growth in trees seems to be unknown, thus we must infer <i>Bacillus subtilis</i> behavior.</p> | |
<p class="title1"> | <p class="title1"> | ||
| Line 138: | Line 138: | ||
<p class="texte"> | <p class="texte"> | ||
| - | <i>Bacillus subtilis</i> is a tree endophyte strain. A study showed that <i>Bacillus subtilis</i> could develop and fully colonize a tree, reaching a concentration of 10⁵ cells per gram of fresh plant. We need to know in which conditions the growth of <i>B. subtilis</i> is optimum in a tree and if the weather can stop its development during winter. | + | <i>Bacillus subtilis</i> is a tree endophyte strain. A study showed that <i>Bacillus subtilis</i> could develop and fully colonize a tree, reaching a concentration of 10⁵ cells per gram of fresh plant. We need to know in which conditions the growth of <i>B. subtilis</i> is optimum in a tree and if the weather can stop its development during winter. Therefore we decided to work on the <i>Bacillus subtilis</i> growth in function of the temperature during the year. |
| + | <br>Modeling bacterial growth in a tree section generates some difficulties. We need to know the distance between two tree extremities (treetops and root) or the speed sap flow. However the speed sap flow can vary with temperature during the day and seasons cause of the type of sap (phloem, xylem). Furthermore a tree is not an homogeneous system: its roots, trunk and branches do not contain the same amount of sap and wood. <br>The average speed of the plane tree sap is 2.4m/h, which means that in a day the sap of a 30m tree will flow from one extremity to the other. Tree is reduced to a bioreactor. | ||
</p> | </p> | ||
<p class="texte"> | <p class="texte"> | ||
| Line 144: | Line 145: | ||
<ol class="list1"> | <ol class="list1"> | ||
<li> | <li> | ||
| - | According to the publication of <b>Xianling Ji</b>, after | + | According to the publication of <b>Xianling Ji</b> (See References), after six months of <i>Bacillus subtilis</i> growth in a tree, bacteria cells reach a concentration of 10⁵ cells per gram of fresh plant. We assume that 10⁵ cells/g is the maximum concentration. |
</li> | </li> | ||
<li> | <li> | ||
| Line 150: | Line 151: | ||
</li> | </li> | ||
<li> | <li> | ||
| - | Only temperature | + | Only temperature impacts on bacterial growth. |
</li> | </li> | ||
<li> | <li> | ||
| Line 163: | Line 164: | ||
<p class="texte"> | <p class="texte"> | ||
| - | An assessment of the <i>Bacillus subtilis</i> growth in a similar | + | An assessment of the <i>Bacillus subtilis</i> growth in a similar sap was performed in laboratory conditions with optimum growth medium for <i>Bacillus subtilis</i>. The composition sap used was the one from birch sap.<br> |
| - | + | In these conditions, the growth rate μ is optimal. From this value we can extrapolate a growth curve as a function of temperature. We used to <b>cardinal temperature model</b>: </p> | |
<center style="margin-bottom:50px;"><img style="" src="https://static.igem.org/mediawiki/2014/8/85/Formules_Rosso.png" alt="cardinal temperature model"></center> | <center style="margin-bottom:50px;"><img style="" src="https://static.igem.org/mediawiki/2014/8/85/Formules_Rosso.png" alt="cardinal temperature model"></center> | ||
| Line 170: | Line 171: | ||
<p class="texte"> | <p class="texte"> | ||
| - | T: Temperature | + | T: Temperature</br> |
| - | + | µ<sub>opt</sub>: Optimal growth rate</br> | |
| - | µ: growth rate at T | + | µ: growth rate at temperature T</br> |
| - | + | T<sub>max</sub> = Maximum temperature supported by bacteria</br> | |
| - | + | T<sub>min</sub> = Minimum temperature supported by bacteria</br> | |
| - | + | T<sub>opt</sub> = Optimum temperature for the growth</br></br> | |
| - | Necessary parameters for this function are minimun temperature | + | Necessary parameters for this function are minimun temperature T<sub>min</sub> and maximum temperature T<sub>max</sub>, optimal temperature for the growth T<sub>opt</sub> and optimal growth rate µ<sub>opt</sub>.</br> |
</br> | </br> | ||
| - | + | T<sub>min</sub>: 10°C</br> | |
| - | + | T<sub>max</sub>: 52°C</br> | |
| - | + | T<sub>opt</sub>: 37°C</br> | |
| - | + | µ<sub>opt</sub>: 8.5968 cfu/d</br></br> | |
| - | The optimal growth rate ( | + | The optimal growth rate (µ<sub>opt</sub>) is obtained experimentally with a similar birch sap environment.</br> |
| - | The growth rate is negative below 10°C (growth | + | The growth rate is negative below 10°C (according to growth tests performed at 10°C and 4°C under similar conditions for the measurement of μ<sub>opt</sub>), survival rate after 24h was 0.3 % at 10°C and null at 4°C.<br> |
Conditions apply:</p> | Conditions apply:</p> | ||
| Line 194: | Line 195: | ||
<center style="margin-top: -52px;"><img style="" src="https://static.igem.org/mediawiki/2014/b/b1/Plot_growth_rate.png" alt="Figure1"></center> | <center style="margin-top: -52px;"><img style="" src="https://static.igem.org/mediawiki/2014/b/b1/Plot_growth_rate.png" alt="Figure1"></center> | ||
| - | <p class="legend"> | + | <p class="legend">Figure 1: bacterial growth (µ) as a function of temperature</p> |
| - | <p class="texte"> A logistic model developed by <b>Hiroshi Fujikawa</b> is used to study bacterial growth.</p> | + | <p class="texte"> A logistic model developed by <b>Hiroshi Fujikawa</b> (See References) is used to study bacterial growth.</p> |
| - | <p class="legend">General logistics formulas</p> | + | <p class="legend">General logistics formulas:</p> |
<center style="margin:-44px 0 65px;"><img style="" src="https://static.igem.org/mediawiki/2014/c/c3/Form_general_fonction.png" alt="General logistics formulas"></center> | <center style="margin:-44px 0 65px;"><img style="" src="https://static.igem.org/mediawiki/2014/c/c3/Form_general_fonction.png" alt="General logistics formulas"></center> | ||
<p class="texte"> | <p class="texte"> | ||
| - | In our | + | In our case, the growth rate µ depends on the temperature. |
| + | <br>N corresponds to the bacterial population, N<sub>min</sub> and N<sub>max</sub> are two asymptotes. | ||
| + | <br>The parameter m is a curvature parameter. Larger m is, smaller is the curvature of the deceleration phase with the model. | ||
| + | <br>The parameter n is a parameter related to the period lag. larger n is, shorter is the period of lag. | ||
| + | <br>N<sub>min</sub> is slightly lower than N<sub>0</sub>, when N is small, close to N<sub>min</sub>, as the initial state (N is equal to N<sub>0</sub>), N<sub>min</sub> / N is almost equal to 1 so the term (1-(N<sub>min</sub>/N)) is less than 1, growth is very slow. If N decrease until reach N<sub>min</sub> the term (1-(N<sub>min</sub>/N)) is equal to 0 thus there can not be any growth. Similarly when N is equal to N<sub>max</sub> the term (1-(N/N<sub>max</sub>)) is equal to 0 and the growth is blocked.</br> | ||
To overcome this we labor under two conditions , positive growth and negative growth, so two equations.This led to the writing of this model:</p> | To overcome this we labor under two conditions , positive growth and negative growth, so two equations.This led to the writing of this model:</p> | ||
Revision as of 14:59, 16 October 2014

Modeling
To develop a predictive model
Project > Modeling
Modeling is a tool used to simplify and study systems. It helps us to predict behavior thanks to bibliographic or experimental informations. The following modelisation focuses on the development of our engineered bacterium (called SubtiTree) in tree. The bacterial growth in trees seems to be unknown, thus we must infer Bacillus subtilis behavior.
Bacterial Growth
Aim
Bacillus subtilis is a tree endophyte strain. A study showed that Bacillus subtilis could develop and fully colonize a tree, reaching a concentration of 10⁵ cells per gram of fresh plant. We need to know in which conditions the growth of B. subtilis is optimum in a tree and if the weather can stop its development during winter. Therefore we decided to work on the Bacillus subtilis growth in function of the temperature during the year.
Modeling bacterial growth in a tree section generates some difficulties. We need to know the distance between two tree extremities (treetops and root) or the speed sap flow. However the speed sap flow can vary with temperature during the day and seasons cause of the type of sap (phloem, xylem). Furthermore a tree is not an homogeneous system: its roots, trunk and branches do not contain the same amount of sap and wood.
The average speed of the plane tree sap is 2.4m/h, which means that in a day the sap of a 30m tree will flow from one extremity to the other. Tree is reduced to a bioreactor.
We make the following hypothesis:
- According to the publication of Xianling Ji (See References), after six months of Bacillus subtilis growth in a tree, bacteria cells reach a concentration of 10⁵ cells per gram of fresh plant. We assume that 10⁵ cells/g is the maximum concentration.
- The composition of the phloem is stable. There is no effect of depletion of the medium.
- Only temperature impacts on bacterial growth.
- It is believed that there is no leakage of cells.
Method
An assessment of the Bacillus subtilis growth in a similar sap was performed in laboratory conditions with optimum growth medium for Bacillus subtilis. The composition sap used was the one from birch sap.
In these conditions, the growth rate μ is optimal. From this value we can extrapolate a growth curve as a function of temperature. We used to cardinal temperature model:

T: Temperature
µopt: Optimal growth rate
µ: growth rate at temperature T
Tmax = Maximum temperature supported by bacteria
Tmin = Minimum temperature supported by bacteria
Topt = Optimum temperature for the growth
Necessary parameters for this function are minimun temperature Tmin and maximum temperature Tmax, optimal temperature for the growth Topt and optimal growth rate µopt.
Tmin: 10°C
Tmax: 52°C
Topt: 37°C
µopt: 8.5968 cfu/d
The optimal growth rate (µopt) is obtained experimentally with a similar birch sap environment.
The growth rate is negative below 10°C (according to growth tests performed at 10°C and 4°C under similar conditions for the measurement of μopt), survival rate after 24h was 0.3 % at 10°C and null at 4°C.
Conditions apply:
If__| T<= 4°C -> µ = -1
____| 4°C
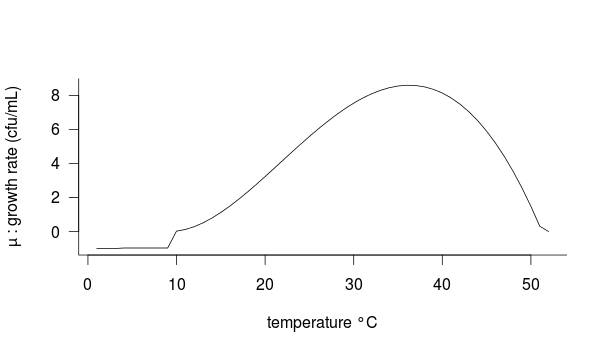
Figure 1: bacterial growth (µ) as a function of temperature
A logistic model developed by Hiroshi Fujikawa (See References) is used to study bacterial growth.
General logistics formulas:

In our case, the growth rate µ depends on the temperature.
N corresponds to the bacterial population, Nmin and Nmax are two asymptotes.
The parameter m is a curvature parameter. Larger m is, smaller is the curvature of the deceleration phase with the model.
The parameter n is a parameter related to the period lag. larger n is, shorter is the period of lag.
Nmin is slightly lower than N0, when N is small, close to Nmin, as the initial state (N is equal to N0), Nmin / N is almost equal to 1 so the term (1-(Nmin/N)) is less than 1, growth is very slow. If N decrease until reach Nmin the term (1-(Nmin/N)) is equal to 0 thus there can not be any growth. Similarly when N is equal to Nmax the term (1-(N/Nmax)) is equal to 0 and the growth is blocked.
To overcome this we labor under two conditions , positive growth and negative growth, so two equations.This led to the writing of this model:

with n = 1 and m = 0.5 Term (1-(Nmin/N)) is not taken into account when there is growth and (1-(N/Nmax)) is not taken into account when there is bacterial decay. Meteorological records of the Toulouse region of 2011-2013 are used to do averages daily temperatures. Thus we can determine B.subtilis growth during a year on Toulouse. This values are obtained for each day by the average on the hightest and the lowest temperature. The density of green wood plane is about 650kg/m³. The average diameter of the trunks of the trees in question is about 0.80m and 15m high. This represents a volume of 30 m³ . The weight of the trunk is therefore 19,604kg . Added to this weight the weight of branches, twigs, leaves about 25% and about 15% of roots (source-FR). The average weight of a plane tree is 27,446kg where in inoculated 10mL of bacterial culture at 10⁹cfu/mL, ie 10^10 bacterial cells. This represents 3.64x10² cfu/g of fresh plant (N0).

Fig 2: (black) Bacillus Subtilis growth curve during one year (N is cells quantity by g of fresh plant). (red) average temperature. (blue) threshold at 10 °C.
In our model, growth starts only from 10°C, which happens between March and April. This period seems to be suitable to put the strain in the tree. From December the temperature decreased below 4°C, threshold below which bacteria die.
Discussion
In practice, temperature variations are certainly lower in tree than outside, especially if roots extend very deep. Composition of the tree sap must also intervene in the growth rate, nutrient content of sap is also temperature dependent. The effects of the decrease of the temperature in winter also involves a fall of the sap and this must also be involved in the disappearance of our strain in the tree. The period of Bacillus subtilis growth is certainly affected by the change in temperature, the rise of sap, its composition variations can consequently slow the growth rate. The modeling work is done with the programming language 'R' script attached.
References
Xianling Ji, Guobing Lu, Yingping Gai, Chengchao Zheng & Zhimei Mu (2008) Biological control against bacterial wilt and colonization of mulberry by an endophytic Bacillus subtilis strain. FEMS Microbiol Ecol 65: 565–573
A. Garnier(1977) Transfert de sève brute dans le tronc des arbres aspects méthodologiques et physiologiques. Ann. Sci. Foresi. 34 (1): 17-45
Heikki Kallio , Tuija Teerinen , Seija Ahtonen , Meri Suihko , Reino R. Linko (1989) Composition and properties of birch syrup (Betula pubescens). J. Agric. Food Chem 37 (1): 51–54
L. Rosso, J. R. Lobry & J. P. Flandrois (1992) AN Unexpected Correlation between Cardinal Temperatures of Microbial Growth Highlighted by a New Model. J. theor. Biol. 162 : 447-463
Hiroshi Fujikawa (2010), Development of a New Logistic Model for Microbial Growth in Foods. Biocontrol of Science Vol 15: 75-80
Annexe
To upload the script and the table Click Here

Socialize

