 "
"
Team:Heidelberg/pages/Reconstitution
From 2014.igem.org
Contents |
Introduction
A common strategy for investigating molecular and cellular biological questions is the use of fusion proteins and to control the functions of these proteins in a spatial and temporal manner. Instead of manipulating proteins on the genomic level, we aimed at editing proteins post-translationally. By using our intein toolbox, one is able to fuse proteins and/or protein tags(Link), as well as reconstitute the function by complementing two formerly split halves of a single protein, and thereby recreate the function of the protein. Mechanistically, the reconstitution of split proteins is identical with the fusion of different proteins to their tags.
To demonstrate the restoration of function of a formerly split protein, we choose a set of fluorescent proteins, whose function can, when properly reassembled, easily be read out using their florescence. Split fluorescent proteins are rarely used in the context of intein splicing. However they are widely applied in bimolecular fluorescence complementation (BiFC) assays [1]. This approach is based on the complementation between fragments of fluorescent proteins that reconstitute its fluorescence when brought into proximity by associated interacting proteins.
Methods
Selection of Split Sites
It is important to select the correct site to splite the fluorescent protein, so that the reconstitution of the fluorescent properties is possible. Therefore, we selected split sites according to previous published research, where the splice sites are mostly in flexible parts connection the β - barrels of the fluorophore. Additionally to fluorescent proteins we choose to create two versions of split luciferases. A list of all designed constructs are depicted in the following table:
| Protein | Split site | Comment |
|---|---|---|
| mRFP | 154/155 | Split between β - barrel 7 and 8 [2] |
| mCherry | 168/169 | Split between β - barrel 8 and 9 [3] |
| GFP | 157/158 | Split between barrel β - 7 and 8 [4] |
| sfGFP | 64/65 | In front of the chromphore region [5] |
| Firefly Luciferase | 437/438 | In flexible tether between the two subunits [6] |
| Renilla Luciferase | 229/230 | split between barrel β - 7 and 8 [7] |
Originally we were going to evaluate the reconstitution of all created constructs by screening the signal to noise ratio using the FACS. Noise can occur due to the possibility of reconstitution of two seperated halves without a splicing reaction, a feature used in the BiFCs assays.
Unfortunately, for time reasons we focused solely on the reconstitution of sfGFP and mRFP (link). We chose the sfGFP to prove the principle of activation by the restoration of the protein halves and to characterize the splicing reaction of the NpuDnaE intein via FACS analysis and Western Blot technique.
Cloning strategy
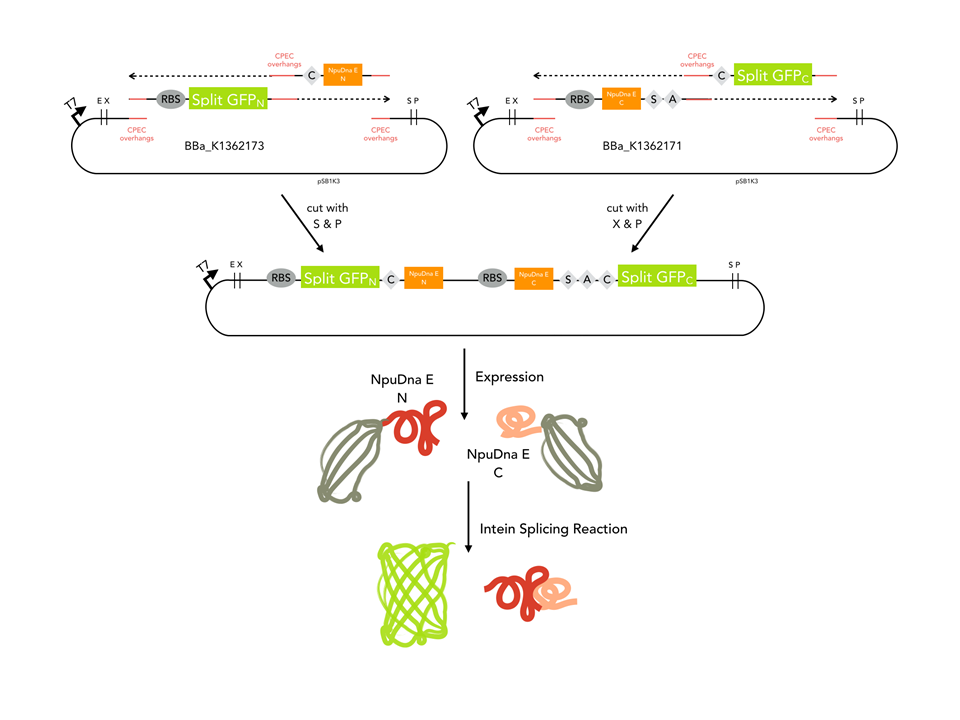
Since our assembly construct with two insertion sites (LINK) was not ready at this point, we choose to follow a fast track cloning strategy to initiate trans- splicing of the split sfGFP. Therefore, we cloned the N-terminal protein part in front of the N- partial split intein NpuDnaE and the C-terminal GFP part (65-225) downstram of the C- portion of the intein using CPEC .The N- and C-terminal parts of GFP were cloned in a bicistronic expression backbone to allow expression from the same promoter via standard biobrick cloning. Also, non-splicing variants were generated by changing the essential cysteine at the N-terminal part of the N-intein to glycine (C > G) and the serine and asparagine in the C-intein to alanine and glycine (SA > AG). In order to splice, the inteins need a cysteine at the amino acid position where the splicing reaction will occur. In this case, the splicing product will harbour a cysteine at amino acid position 65. To ensure that the inserted cystein does not interfere with the fluorescence of the reconstituted sfGFP, we cloned a positive control of sfGFP by insertion of the cystein using mutagenesis PCR.
Fluorescence measurement
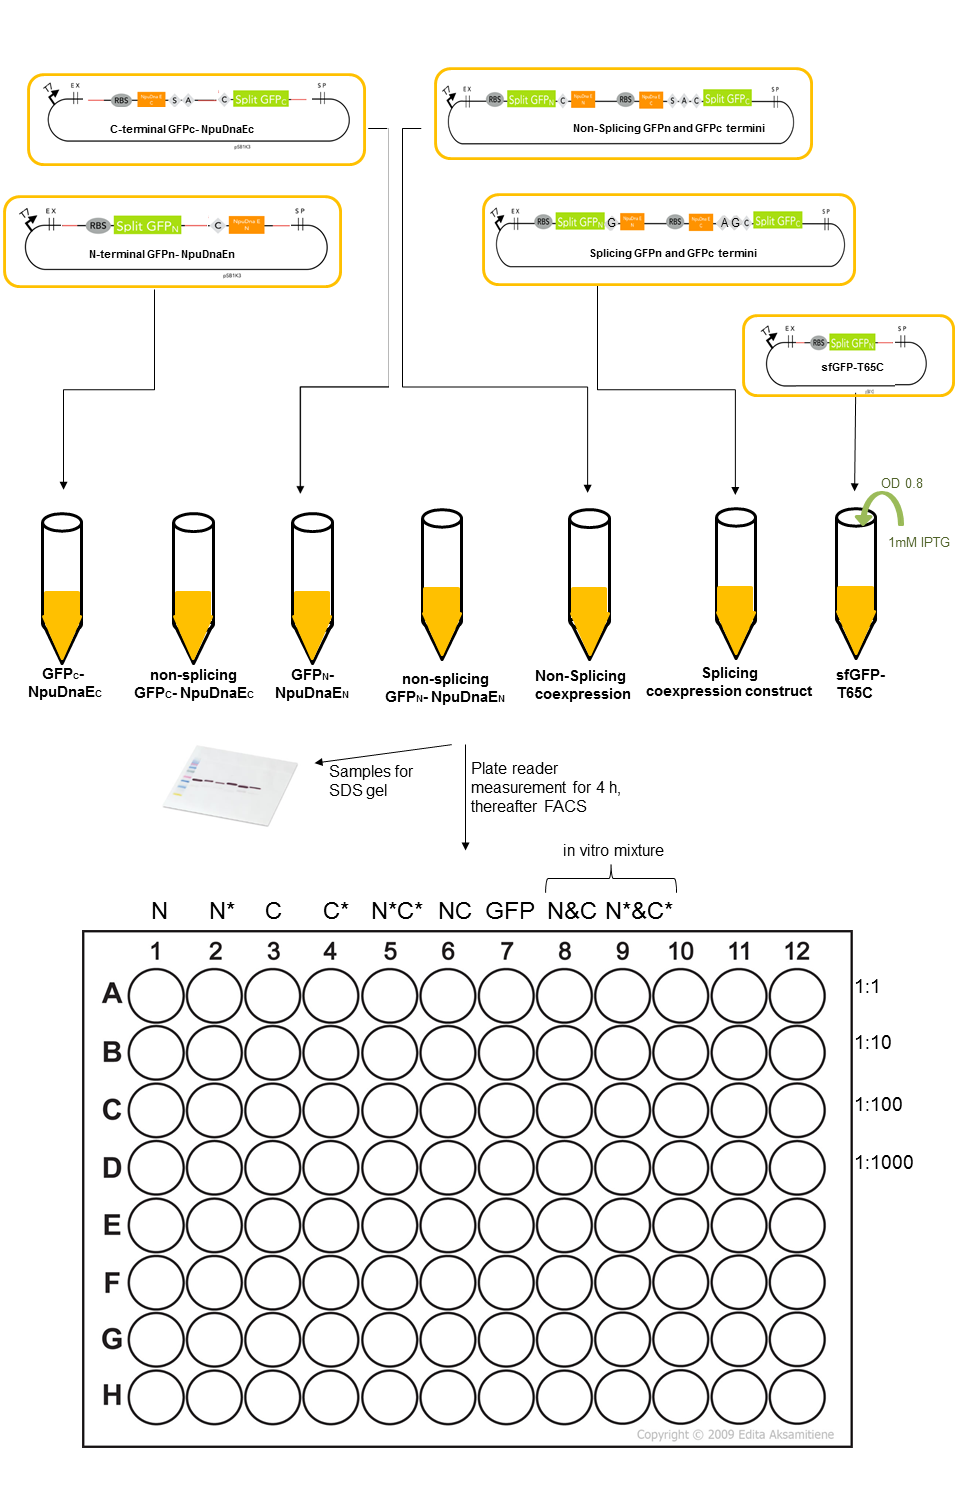
We expressed the split sfGFP construct with the various controls in BL21(DE3). 5ml cultures were inoculated with 500 µl of an overnight culture and induced with 1mM as soon as the cultures reached the OD600 of 0.8. The cultures incubated at 37 °C for further 4 hours. Subsequently the fluorescence was measured in a TECAN plate reader and the FACS. To ascertain the best excitation and emission wavelength in the plate reader we tested several excitation and emission wavelengths. The excitation at 475 nm and emission at 512 nm turned out to be most suitable for sfGFP. To validate our results we conducted several assays with a series of biological replicates following the same experimental layout. 300 µl of each sample were taken to measure the fluorescence in the plate reader on a black 96 well plate and a 1:1000 dilution of the original culture was prepared for the FACS measurements. The laser settings were adjusted at 488 nm excitation and 497 - 522 nm emission range. The samples were loaded as described in the illustration below. Besides the in vivo expression and splicing reaction, also a mixture of N- and C-terminal split GFP-NpuDnaE in vitro was scheduled. In order to conduct a Western Blot the cells were harvested by centrifugation for 5 min at 3270 rcf at 4 °C. Subsequently they were re-suspended in 500 µl PBS on ice and sonicated for 2 min at 50% power on ice. The samples were centrifuged at 18000 rcf for 10 min and the supernatant was re-suspended in 500 µl PBS on ice. For the Western Blot and Coomassie Gels, the samples were mixed with 100 µl 5x Lämmli-Buffer and 10 µl were loaded on the SDS-Gel.
Results
The CPEC cloning method seems to be a straightforward strategy to assemble several parts simultaneously. However CPEC with more than two inserts and one backbone hit on problems on the beginning of our project. Therefore our assembly construct with two insertion sides was not ready at the time point when we started with our fast track sfGFP assay to verify trans- splicing of NpuDnaE and the restoration of a protein’s functionality upon splicing. We decided to prove the fusion and activation of proteins with a fast track sfGFP assay, which we designed using CPEC cloning with only two inserts. The two inserts for the N-terminal part resulted in sfGFPN that includes amino acid 1 to 65 and the split intein NpuDnaEN, altogether reaching a size of 940 bp. Respectively, the C-terminal construct consists of NpuDnaEC-sfGFPc (65-225) with a size of 1074 bp. Subsequently the constructs were cloned on the same plasmid to allow bicistronic expression.
Cl
After expression of the sfGFP halves and split inteins, either as N- and C- terminal constructs separated of each other or combined on one plasmid, the fluorescence was measured via plate reader and FACS. In course of the experiments the measurements focused on read-out via FACS, since this approach promises a more precise evaluation of fluorescence in single cell resolution.
Mehr Bla bla bla bla bla... etc
The results of the plate reader show an 100x increase of fluorescence compared to background signal when both, N- and C- terminal parts, are expressed in vivo and thus are able to splice. However it does not accomplish the levels of fluorescence that the wild type sfGFP reaches. In comparison to the splicing construct, the wild type achieves a 1000x brighter signal. The mixture of N- and C- terminal construct in vitro after lysis of the cells revealed no fluorescence, indicating that no splicing reaction took place.
However we were missing the correct negative control at that time point, which should comprise of a co-expressing construct that is not able to splice. This important control is included in the following FACS data and reveals the fluorescence that is created by the mere proximity of the sfGFP halves.
The FACS data is showing a clear spectral shift towards the green fluorescence range for the splicing construct compared to the non-splicing control. Likewise the single halves do not show fluorescence on their own. However after 4 hours of induction the splicing product does not reach the same amount of fluorescence as the wild type sfGFP or our mutated sfGFP-T65C.
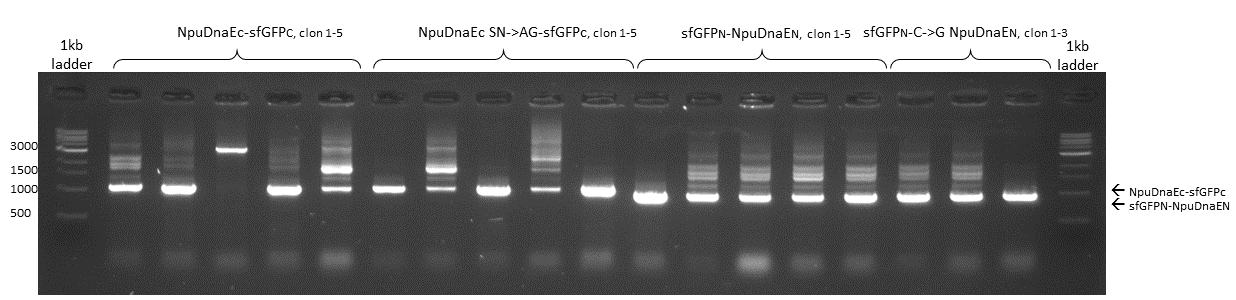
Agarose gel that shows colony PCRs of the NpuDnaEc- sfGFPc half and sfGFPn- NpuDnaEN half, which was assembled with our expression vector pSBX1K3 via CPEC. Colony PCR of NpuDnaEc- sfGFPc results in a band of 1074 bp and sfGFPN-NpuDnaEN in a band of 940 bp. Sequencing results are available as well.
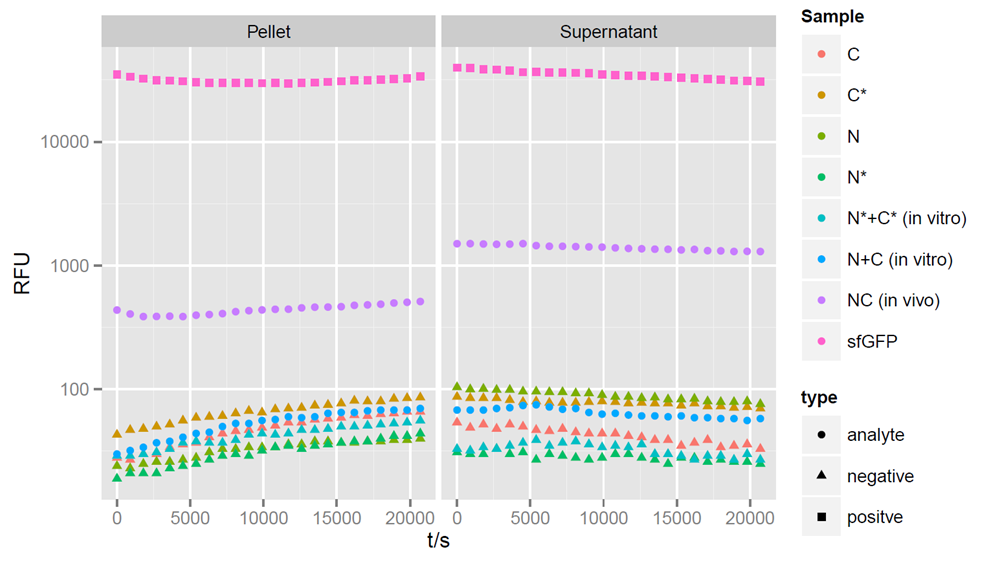
showing fluorescent values at 475nm exitation and 512 nm wavelength for a period of 6 hours after induction. It is obvious that the halves itselves barely fluoresce. When the protein halves are expressed simultaneously in the cell, fluorescence is reconstituted about 100x above the background signal of the halves alone. A positive full length wildtype GFP instead is 10.000x brighter than the background signal.
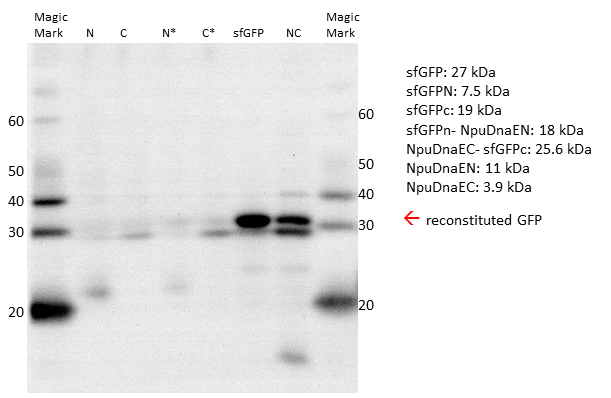
Western Blot with His-antibody. In the first line the N-terminal sfGFPn-NpuDnaEN (N) and in the second line the C-terminal NpuDnaEC-sfGFPC (C) is expressed. The third and fourth band show the expression of non- splicing halves, respectively. Further sfGFP is visible around 30 kDa. The same band size is visible in the co-expression (NC) samples, which implicates the reconstitution of sfGFP.
Also the Western Blot of the expressed constructs shows a significant amount of GFP reconstitution. In the first third line a band at around 20 kDa is clearly visible and resembles the sfGFPN-NpuDnaEN (N) and its non-splicing counterpart (N*). The second and fourth line display a band at around 30 kDa, which shows the NpuDnaEc-sfGFPc (C) and its non-splicing counterpart (C*), respectively. The sample including sfGFP generates a fat band at around 30 kDa. The splicing construct attains a very prominent band of same size, anyhow it is still clearly distinguishable from the NpuDnaEc- sfGFPc band below.
Discussion
Outlook
References
[1] Hu, C-D, & T.,K., Kerppola. Simultaneous visualization of multiple protein interactions in living cells using multicolor fluorescence complementation analysis. Nat Biotechnol. 21(5), 539-545 (2003).
[2] Jach, G., Pesch, M., Richter, K., Frings, S., & Uhrig, J., F. An improved mRFP1 adds red to bimolecular fluorescence complementation. Nature Methods, 3, 597-600 (2006).
[3] Furman, J., L., Badran, A., H., Shen, S., Stains, C., I., Hannallah, J., Segal, D., J., Ghosh, I. Systematic evaluation of split-fluorescent proteins for the direct detection of native and methylated DNA. Bioorg Med Chem Lett, 19(14), 3748-3751 (2009).
[4] Oyawa, T., Takeuchi, M., Kaihara, A., Sato, M., Umezawa, Y. Protein splicing-based reconstitution of split green fluorescent protein for monitoring protein-protein interactions in bacteria: improved sensitivity and reduced screening time. Anal. Chem, 73, 5866-5874 (2001).
[5] Aranko, A., S., Oeemig, J., S., Kajander, T., & Iwai, H. Intermolecular domain swapping induces intein-mediated protein alternative splicing. Nat. Chem. Bio., 9, 616-622 (2013).
[6] Ozawa, T., Kaihara, A., Sato, M., Tachihara, K., Umezawa, Y. Split luciferase as an optical probe for detecting protein- protein interactions in mammalian cells based on protein splicing. Anal. Chem, 73, 2516-2521 (2001).
[7] Kim, S. B., Ozawa, T., Watanabe, S., Umezawa, Y. High- throughput sensing and noninvasive imaging of protein nuclear transport by using reconstitution of split renilla luciferase. PNAS, 101, 11542–11547 (2004).