 "
"
Team:Heidelberg/pages/Enzyme Modeling new
From 2014.igem.org
Contents |
Introduction
Enzyme kinetics is a widely studied field in biology. From the derived kinetic parameters one can make many different predictions about the function of a certain enzyme. A commonly used approach for the determination of the enzyme kinetic parameters, is the measurement of the reaction rate in time-dependent manner and with varying substrate concentrations. As this approach would be too laborious to apply in a high throughput manner, we instead decided to record the degradation curves for each lysozyme.
As described in the linker-screening part, we try to infer the loss of activity of $\lambda$-lysozyme due to heatshock, by observing the kinetic behavior on the degradation of M. lysodeikticus. The process, which ultimately leads to a change of turbidity, is very complex and has been widely discussed for more than 40 years now.
Figure: Michaelis-Menten kinetics with competitive product inhibition. Reaction mechanism
Michaelis Menten kinetics and Competitive Enzyme Kinetics
Michaelis Menten theory describes the catalytical behaviour of enzymes in simple reactions. It's basic reactions are assumed as \[ E + S \, \overset{k_f}{\underset{k_r} \rightleftharpoons} \, ES \, \overset{k_\mathrm{cat}} {\longrightarrow} \, E + P \] , with E the enzyme, S substrate, ES the enzyme-substrate complex and P the reaction product. $k_r$, $k_f$ and $k_\mathrm{cat}$ are catalytical constants. This means part of the enzyme is always bound in an enzyme substrate complex. This kinetic behavior can be simplified in the basic differential equation: \[\frac{d\left[S\right]}{dt} = \frac{- V _{max} \left[S\right]}{K_m + \left[S\right]} \]. V_{max} is the maximum reaction velocity, obtained from $V_{max} = k_{cat} * E$ and $K_m$ being the michaelis-menten constant
Competitive product inhibition has the effect, that part of the Enzyme is also bound in the enzyme-product complex EP. This leads to an apparent increase of $K_m$ as: $K^\text{app}_m=K_m(1+[I]/K_i)$ Thus the differential equation changes as: \[\frac{d\left[S\right]}{dt} = \frac{- V _{max} \left[S\right]}{K_m \left( 1 + \frac{S_0 - S}{k_i} \right) + \left[S\right]} \] where $S_0$ means the substrate concentration at start of the reaction and $k_i$ an inhibitory constant.
Methods
Data
Using the Lysozyme Assay assays we have obtained over 1000 degradation curves for different lysozyme variants and attempted to make predictions about the thermal stability of the different enzymes (REF). For nearly all of the 9 different lysozymes not only two biological replicates from independent culture preparations but also at least 4 technical replicates were measured at certain temperatures the data were measured.
Notice, that in regards to conditions used for the measurements, particular care was taken for the following aspects: The reactions always took place at the same temperatures. Also another crucial part was the time after adding the enzyme to the substrate: This was minimized as much as possible and we tried to keep it constant. We always made the dilutions in buffer from the same stock, in order to keep salt concentrations fixed.
OD to concentration calibration
There was performed a measurement for calibrating the $OD_{600}$ to substrate concentration. We have seen that until a substrate concentration of 0.66 mg/ml in the 300 µl wells the behaviour is linear with an offset due to the protein mix and the well plate. We have concentrationdifferences result in an $OD_{600}$ difference of: $\delta \mathit{OD} = (1.160 +- 0.004 \frac {\mathtext{ml}} {\mathtext{mg}} * \delta \mathtext{concentration}$. With this result one can easily calculate the concentration differences in each assay. Also the $OD_{600}$ of a well, where all the substrate was completely degraded needed to be measured. We found out, that the influence of the added protein mix on the $OD_{600}$ could be neglected.
Assumptions and data-based considerations
The time between when lysozyme was added to the substrate and the first measurement in the platereader was measured and assumed that it nearly took the same time for each measurement with normally distributed errors. Also, the platereader took about 1s for measuring one well. This delay was also taken into account.
Results
To analyze the effect of circularization on the thermostability of the lysozyme variants, the heat shock dependent reaction rate parameters $v_{max}$ for all lysozyme variants had to be identified. For this purpose we analyzed the observed substrate degradation dynamics for the different lysozyme variants by ODE modeling. As detailed in the introduction, the enzymatic reaction mechanism of the lambdaphage lysozyme can be described by Michaelis-Menten kinetics with product inhibition. Furthermore, experiments on pH-dependent lysozyme degradation have shown that lysozyme exists in two distinct states when challenged with pH changes: the normal, functional state and a detured, nonfunctional state (REF). We hypothesized that lysozyme deformation under heat shock conditions could be described by a similar shift from a functional conformation to a distinct, denatured state. Consequently, enzymatic activity after heat shock was assumed to be exerted by only one, homogeneous, population of functional lysozymes, differing in size depending on heat shock intensity. Because the structure of the active enzyme species was assumed to be identical independent of the applied heat shock, the kinetic parameters of the enzymatic reactions could be assumed to be independent of heat shock intensity. Therefore, based on this model of enzyme denuration, enzymatic activity after heat shock could be assumed to be only dependent on the remaining fraction of functional lysozymes.
This model was fitted to all available data, using simultaneous multi-model fitting where appropriate. The model could emulated the substrate degradation dynamics for all lysozyme variants (Fig 1). Profile likelihood-based identifiability analysis was employed to verify practical identifiability of the relevant kinetic parameters. While the kinetic parameters representing enzyme affinity for the substrate and the inhibitors could not be identified in the model, the maximal reaction rate $v_{max}$ where identifiable in all cases (Fig 2). The complete result of the profile likelihood analysis can be found here.
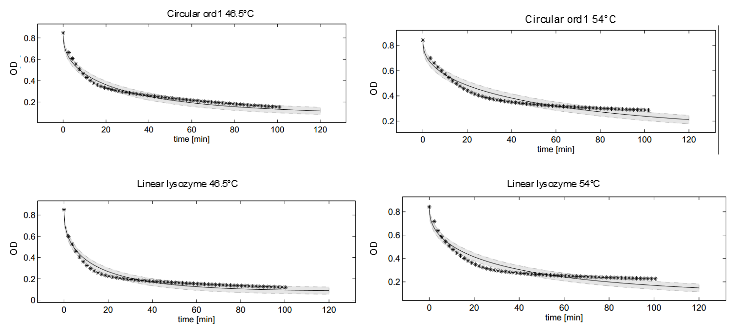
Dynamics of peptidoglycan degradation by the lambdaphage lysozyme can be emulated by a simple model assuming Michaelis-Menten kinetics with competitive product inhibition. The model was implemented with the assumption that lambdaphage lysozyme exists in two distinct states – functional or deformed - after heat shock within the considered range of intensities (citation). Following this assumption, kinetic parameters of the enzymatic reaction can be assumed to be independent of heat shock intensity. Thus, model complexity is considerably reduced, as explained in detail in the text. Exemplary measurements of peptidoglycan degradation by the linear lysozyme (a) and by a circularized lysozyme with the sg1 linker (b) are shown together with model fits. Substrate degradation is shown for basal enzyme activity after 10 min incubation at 37 °C and for diminished activity after 10 min incubation at 42 °C.
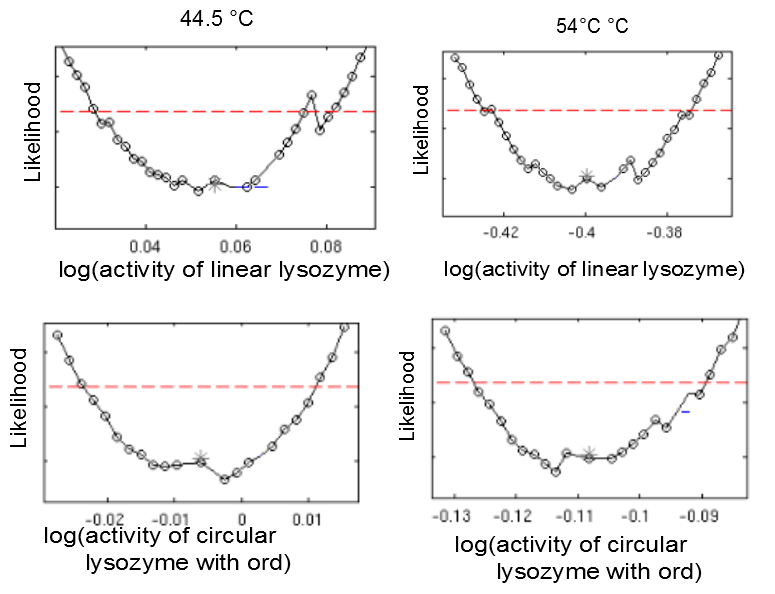
Heat shock dependent maximal reaction rates $v_{max}$ are identifiable for all lysozyme variants. Likelihood profiles of $v_{max} after 10 min incubation at 37 °C and 42 °C are shown for the linear lysozyme (a) and a circularized lysozyme with the sg1 linker (b). Likelihood profiles for all parameters are documented here.
To compare thermostability of the different lysozyme variants, we analyzed the relationship between heat shock intensity and loss of enzymatic activity. As a measure for enzymatic activity, we used the normalized maximal reaction rate (the ratio of the enzymatic activity after heat shock and the basal enzymatic activity after incubation at 37 °C). Heat-shock dependent loss of enzymatic activity differed considerably between the different lysozyme variants (Fig 3). For a direct comparison of lysozyme variant thermostability we sought a robust statistic characterizing heat-shock resistance. This statistic should incorporate the threshold heat-shock intensity upon which significant loss of activity occurs as well as the steepness of the heat-shock intensity dependent loss of activity. We decided to focus on the heat-shock intensity window where most of the enzymatic activity was lost (X degree °C to Y °C). Loss of enzymatic activity was characterized by the average enzymatic activity in this window (Fig. Y).

Heat-shock dependent enzyme activity for the linear lysozyme and 8 circularized lysozyme variants. Enzymatic activity is described here as the normalized maximal reaction rates, computed as the ratio of the maximal reaction rate after heat shock at the respective temperature and the maximal reaction rate after incubation at 37 °C. Two biological replicates were available for 7 of the 9 lysozyme variants and the $v_{max}$ values computed for each replicate are plotted separately. Temperature dependent decrease of the enzyme activity was fitted by splines to provide a better visualization of the relationship of heat shock intensity and enzyme deformation.
Figure: Introduction of heat shock dependent reaction rates does not significantly improve the model fit. It was tested whether the model fit could be improved by assuming that heat shock induced enzyme deformation occurs gradually and not in distinct stages. In this case, the kinetic parameters of the enzymatic activity are dependent on the heat shock intensity. Exemplary measurements of peptidoglycan degradation by the linear lysozyme at 37 °C are shown for the simplified model assuming heat shock independent kinetic parameters (a) and the full model with heat shock dependent kinetic parameters (b). These data illustrate the general observation that the model fit was not significantly improved (see text for details).
Finally, we tested whether the mechanistic assumption of a distinct transition between a single active and inactive state upon heat shock had affected the quality of the model fit. The alternative hypothesis concerning the mechanism of enzyme deformation would allow for continuous changes of the lysozyme structure in response to heat shock intensity. Thus, a gradual shift towards more deconformed structures would be expected for higher heat shock intensities. This would result in different kinetic parameters for the same lysozyme species under differing heat shock treatment. To test the effect of implementing this alternative deconformation mode in the model, model fitting was repeated with independent kinetic parameters for different heat shock intensities. Manual inspection of the fitting results did not show a better fit to the data. However, freeing the kinetic parameters resulted in a loss of parameter identifability. Therefore, the increased number of kinetic parameters was considered to negatively affect the usability of the model and the original, parameter-reduced, model structure was retained for analysis.
Figure: Introduction of heat shock dependent reaction rates interferes with parameter identifiability in the model. Likelihood profiles of $v_{max}$ after 10 min incubation at 37 °C and 42 °C are shown for the linear lysozyme (a) and a circularized lysozyme with the sg1 linker (b). Likelihood profiles for all parameters are documented here.
Discussion
Using dynamic ODE modeling, we could extract the heat-shock dependent maximal reaction rates of different lysozyme variants from simple substrate degradation measurements. The $v_{max}$ parameters were identifiable in spite of the complex reaction mechanism of the lysozyme. This allowed us to compute a normalized enzymatic activity for all lysozyme variants after a variety of different heat shock challenges. By comparing these enzymatic activities, thermostability of the different lysozymes variants could be directly compared.
Our findings show that circularization of the lysozyme can have a considerable influence on enzyme thermostability. Similar findings have been reported for a variety of other proteins (sources). Here, we extend previous findings by demonstrating that the effect of circularization strongly depends on the chosen linker structure. Suboptimal linker design can decrease thermostability. The most evident example in the findings presented here is the sho2 linker which was chosen for testing as an example for linkers too short to bridge the natural distance between the C- and N-terminus of the lysozyme. In silico guided design of optimized linker sequences on the other hand can indeed result in increased thermostability, as demonstrated by the ord1 and ord3 linkers. These linkers where chosen as examples for linkers with a very low likelihood of crossing the active center of the enzyme. The implications of this analysis for the linker design are discussed in more detail in the documentation of the linker design software (here).