 "
"
Team:Evry/Notebook/Interlabstudy/Week7
From 2014.igem.org
(Difference between revisions)
| Line 77: | Line 77: | ||
</div> | </div> | ||
| - | |||
<br/> | <br/> | ||
We expected to obtain one band per PCR sample corresponding to the interesting amplified fragment. | We expected to obtain one band per PCR sample corresponding to the interesting amplified fragment. | ||
| Line 104: | Line 103: | ||
</a> | </a> | ||
</div> | </div> | ||
| - | <center>Figure 2: 1% agarose gel of PCR products from 08.12.2014 after PCR clean up. Lane 1 and 7: Purple 2-Log ladder NEB, Lane 2: BBa_J23101, Lane 3: BBa_J23115, Lane 4: BBa_E0240, Lane 5: BBa_I20260 and Lane 6: pBHR1 PCR product | + | <center>Figure 2: 1% agarose gel of PCR products from 08.12.2014 after PCR clean up. Lane 1 and 7: Purple 2-Log ladder NEB, Lane 2: BBa_J23101 purified PCR product, Lane 3: BBa_J23115 purified PCR product, Lane 4: BBa_E0240 purified PCR product, Lane 5: BBa_I20260 purified PCR product and Lane 6: pBHR1 purified PCR product </center> |
</div> | </div> | ||
</div> | </div> | ||
</div> | </div> | ||
</div> | </div> | ||
| + | |||
| + | <br/> | ||
| + | We expected to obtain one band per PCR sample corresponding to the interesting amplified fragment. | ||
| + | For Lane 2, 3 and 6 it was ok. We had the expected profile. By contrast 2 bands were visible, one at the expected size (around 1200 bp) and another around 600 bp. We decided to perform a purification on gel of each bands. | ||
| + | <br/> | ||
Revision as of 16:06, 15 August 2014
Week 7
Interlab Study
08.12.2014
The 4 needed parts are: BBa_J23101, BBa_J23115, BBa_E0240 and BBa_I20260. Corresponding wells were located on 2014 Distribution kit plates and resuspended with 10 µL steril water. That permits to obtain a DNA concentration around 0.2 ng/µl (according to the registry. Solutions were transferred into 1 ml eppendorf tubes and stored at -20°C.
To amplify fragments, a PCR was performed on the 4 constructions, with the mix described on table 1.


Table 1: PCR mix preparation
Distribution of 49 µl of mix per PCR tube. Application of program IGEM Q5 PCR.

Table 2: IGEM Q5 PCR program thermocycling conditions
Preparation of a 1% agarose gel: 0.56 g of Top Vision agarose (Thermo Scientific) + 50 ml of TAE 1X.
Microwave 30s by 30s until agarose total dissolution
Gel was cooling down until to be lukewarm, one BET drop was added.
Gel was loaded with 10µl per sample previously added with 2 µl of loading dye 6X, and 5 µl for ladders.
Gel running 45 minutes at 100 mV in TAE 1X buffer.

Figure 1: 1% agarose gel of PCR products. Lane 1: BBa_J23115 PCR product, Lane 2: pBHR1 PCR product, Lane 3 and 6: Purple 2-Log ladder NEB, Lane 4: BBa_E0240 PCR product, Lane 5: BBa_I20260 PCR product, Lane 7: 1 Kb plus Ladder Ogene Ruller and Lane 8: BBa_J23101 PCR product
We expected to obtain one band per PCR sample corresponding to the interesting amplified fragment.
08.13.2014
PCR products were cleaned with the GeneJET purification kit (Thermo Scientific).
DNA quantification with the NanoDrop 2000 (Thermo Scientific).
Preparation of a 1% agarose gel: 0.56 g of Top Vision agarose (Thermo Scientific) + 50 ml of TAE 1X.
Microwave 30s by 30s until agarose total dissolution
Gel was cooling down until to be lukewarm, one BET drop was added.
Gel was loaded with 10µl per sample previously added with 2 µl of loading dye 6X, and 5 µl for ladders.
Gel running 45 minutes at 100 mV in TAE 1X buffer.
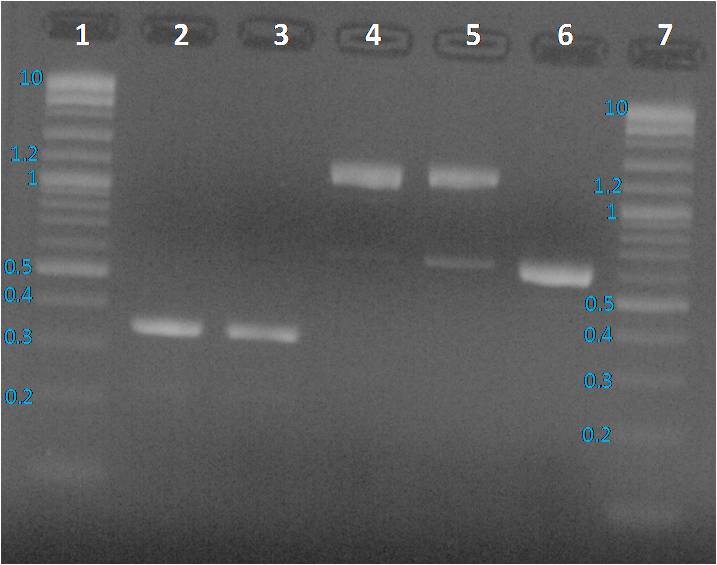
Figure 2: 1% agarose gel of PCR products from 08.12.2014 after PCR clean up. Lane 1 and 7: Purple 2-Log ladder NEB, Lane 2: BBa_J23101 purified PCR product, Lane 3: BBa_J23115 purified PCR product, Lane 4: BBa_E0240 purified PCR product, Lane 5: BBa_I20260 purified PCR product and Lane 6: pBHR1 purified PCR product
We expected to obtain one band per PCR sample corresponding to the interesting amplified fragment.
For Lane 2, 3 and 6 it was ok. We had the expected profile. By contrast 2 bands were visible, one at the expected size (around 1200 bp) and another around 600 bp. We decided to perform a purification on gel of each bands.
08.14.2014
Interlab Study
08.12.2014
The 4 needed parts are: BBa_J23101, BBa_J23115, BBa_E0240 and BBa_I20260. Corresponding wells were located on 2014 Distribution kit plates and resuspended with 10 µL steril water. That permits to obtain a DNA concentration around 0.2 ng/µl (according to the registry. Solutions were transferred into 1 ml eppendorf tubes and stored at -20°C.
To amplify fragments, a PCR was performed on the 4 constructions, with the mix described on table 1.
Distribution of 49 µl of mix per PCR tube. Application of program IGEM Q5 PCR.
Microwave 30s by 30s until agarose total dissolution Gel was cooling down until to be lukewarm, one BET drop was added. Gel was loaded with 10µl per sample previously added with 2 µl of loading dye 6X, and 5 µl for ladders. Gel running 45 minutes at 100 mV in TAE 1X buffer.
Lane 1: BBa_J23115 PCR product, Lane 2: pBHR1 PCR product, Lane 3 and 6: Purple 2-Log ladder NEB, Lane 4: BBa_E0240 PCR product, Lane 5: BBa_I20260 PCR product, Lane 7: 1 Kb plus Ladder Ogene Ruller and Lane 8: BBa_J23101 PCR product
We expected to obtain one band per PCR sample corresponding to the interesting amplified fragment.
08.13.2014
PCR products were cleaned with the GeneJET purification kit (Thermo Scientific).DNA quantification with the NanoDrop 2000 (Thermo Scientific).
Preparation of a 1% agarose gel: 0.56 g of Top Vision agarose (Thermo Scientific) + 50 ml of TAE 1X.
Microwave 30s by 30s until agarose total dissolution Gel was cooling down until to be lukewarm, one BET drop was added. Gel was loaded with 10µl per sample previously added with 2 µl of loading dye 6X, and 5 µl for ladders. Gel running 45 minutes at 100 mV in TAE 1X buffer.
We expected to obtain one band per PCR sample corresponding to the interesting amplified fragment. For Lane 2, 3 and 6 it was ok. We had the expected profile. By contrast 2 bands were visible, one at the expected size (around 1200 bp) and another around 600 bp. We decided to perform a purification on gel of each bands.