Curve fitting
Besides the simulation of our system, data processing is needed for.
Then the curve fitting part will be the future work.
The following are the experiment results:
For the matlab program, since we only have the absorbance of GFP, the curve fitting step becomes difficult. Still, we use the open source, OPI tool box to solve the dynamic model parameters. We’ll now show the following parts by steps.
- Parameters settings and initial conditions
- settings for standard figure and different comparisons among parameter adjustment
- Verification and conclusion
1. Parameters settings and initial conditions
2. settings for standard figure and different comparisons among parameter adjustment
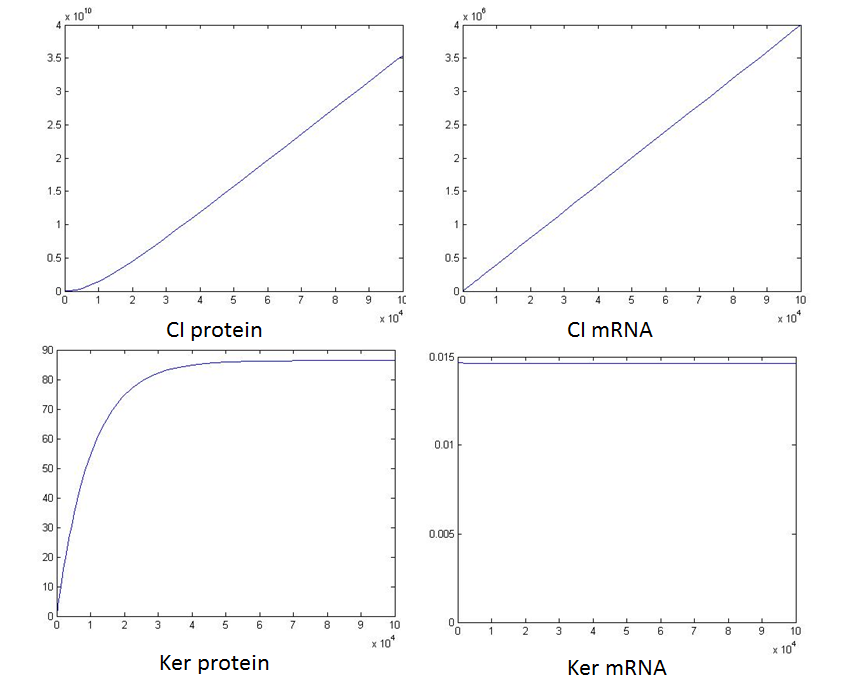
settings for standard figure:
Different comparisons among parameter adjustment

(1). adjustment of TE value : Findings: TE value is the absolute rather than the relative value of rbs. Ajusting TE value can alter the magnitude of concentration. (comparison with standard)
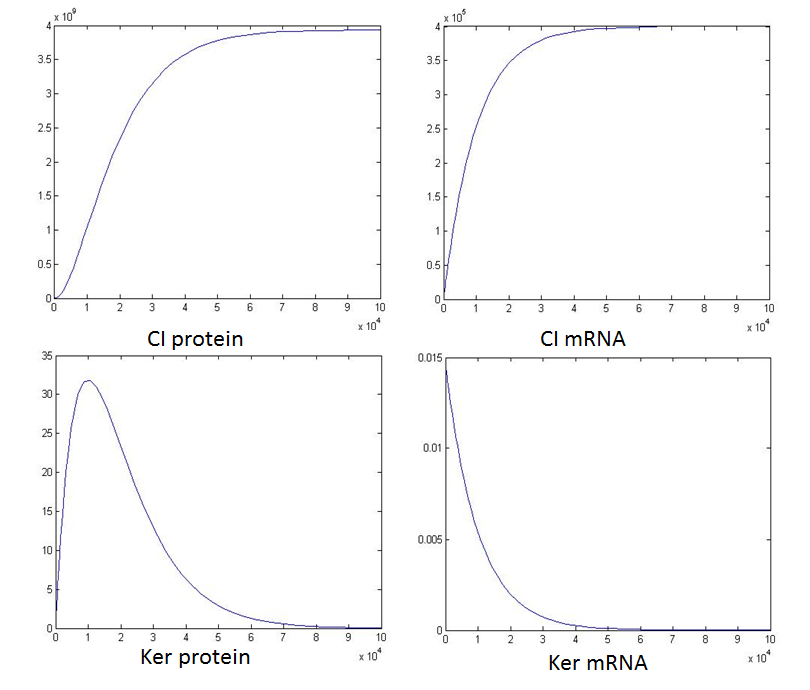
(2). Adjustment of degration rate of mRNA and Protein : Findings: Ajusting degration rate can alter the time scale. (comparison with standard) We illustrate the result by showing different combinations of adjusting degration rate of mRNA and protein. ❖ altering protein degration rate
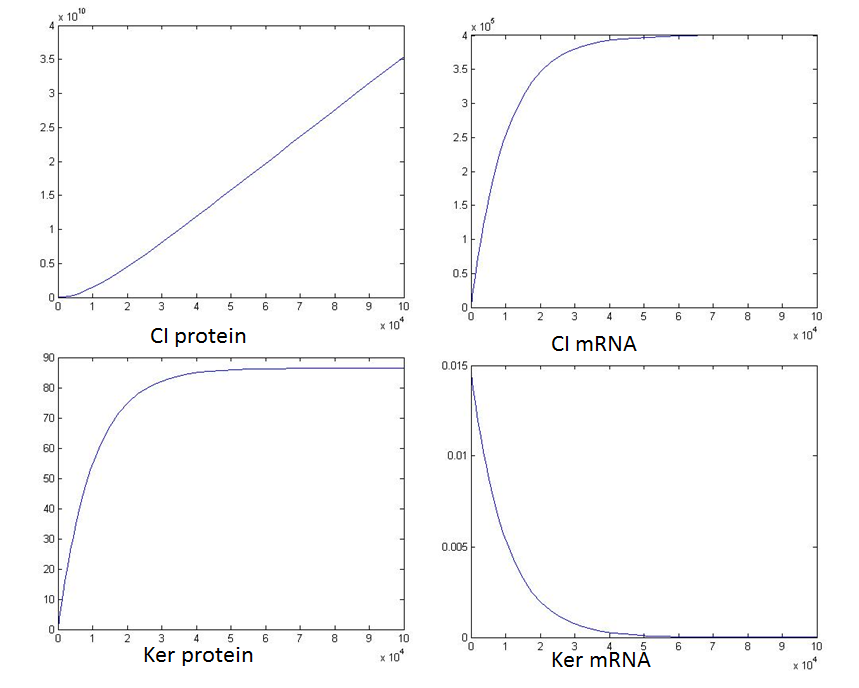
❖ altering mRNA degration rate

❖ altering both protein and mRNA degration rate

(3). adjustment of promoter PfadBA strength: Findings: Increasing PfadBA streingth will increase concentration of CI and decrease the concentration of GFP. (comparison with standard)
(4). adjustment of the concentration of ayl-CoA: Findings: decreasing the concentration of acyl-coA, the concentration of CI will decrease and GFP will increase. (comparison with standard)

(5). Overexpression of FadL and FadR : Findings: Thereotically, when we overexpression the FadL and FadR (under non-overexpression of acyl-coA), the concentration of CI must decrease due to the competition between acyl-coA and FadR. However, the result remain the same. We assume that it might be our limitation of curve fitting due to the lack of experimental data. And thus we aren’t able to use the whole differential functions(see the parameter setting and initial conditions above)
3. Verification and conclusion
According to the IGEM Registry, POPS(polymerase per second) and RIPS (ribosome initions per second) are the actual standardized output we want to know.
Based on the equilibrium function proposed by SYSU-Software 2013, we have:
Here, the DeRNA(degration rate of mRNA) is 10-4 and the TE of rbs30, rbs34 are 0.6 uM, 1uM respectively. Thus, we can acquire the RIPS for rbs30 and rbs34:
RIPSrbs30 = 0.006
RIPSrbs34 =0.01
The results correspond with the reference paper, which means the absolute TE values we use in our model are appropriate, and also verify the equilibrium function proposed by SYSU-Software 2013.
 "
"