 "
"
Team:Heidelberg/Project/Linker Screening
From 2014.igem.org
– Proof and calibration of the CRAUT linker software in the wet-lab
We developed a modeling approach to design linkers that can circularize proteins and that may confer some rigidity in particular after heat shock. The general concept of the approach can be found in the Software, and the detailed theoretical development can be found in the software as well as in the Modeling sections.
The experimental work presented in this section has two main goals. The first one was testing the validity of the idea: Can rigid linkers with angles indeed provide heat stability to a protein, and can it do this better than flexible linkers? And the second one was to measure this stabilization depending on the properties of the linkers to calibrate the Linker Software. As already seen in the software part, these properties are the total length of the linker, the angles between consecutive alpha helices, the regions that the linker passes and the distance from the proteins surface. As we had no a priori knowledge on the contribution of those different properties for the heat stability of protein, we performed an extensive linker screening on the lambda phage lysozyme. The tested linkers were predicted to belong to different groups by the software: Very good, good, average, bad and too short. By measuring their activity after heatshock, we could transform this qualitative classification into a quantitative one.
Introduction
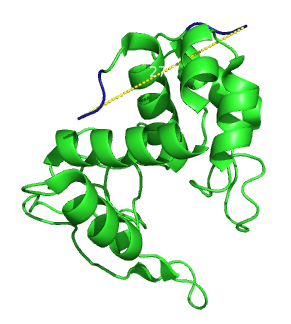
Secondary structure of lambda lysozyme. The distance between the two ends is 27.3 Ångström.
First, we needed a crystal structure of the complete protein at high resolution. Second, the ends should be separated by a distance of 15 to 30 Ångström, so that the rigid linkers containing alpha helices would be relevant. On the other hand, the linker should not pass over the active site of the protein. Furthermore it should be easy to obtain.
Lysozymes are well characterized enzymes that are able to digest the peptidoglycans that form the bacterial wall. This process is performed by many different species for different applications, including antibacterial defence by plants and animals [1] or bacterial penetration by viruses [2]. On top, lysozyme is applied in different fields of biotechnology and medicine. It is notably one of the most important proteins in food preservation and is produced in the 100 tons scale a year. We anticipated that the lysozyme of the bacteriophage lambda could reasonably fulfill the requirements for our linker screen.
Its crystal structure is known [2] and the ends are 27.3 Angströms apart (figure.1). It is easy to obtain: one can clone it from the bacteriophage lambda genome, and express it in E.coli. The fact that the overexpression of the enzyme eventually lyse the cells was not considered as a problem as long as enough enzyme would be produced. Finally substrates to measure the enzymatic activity are commercially available.
Main results
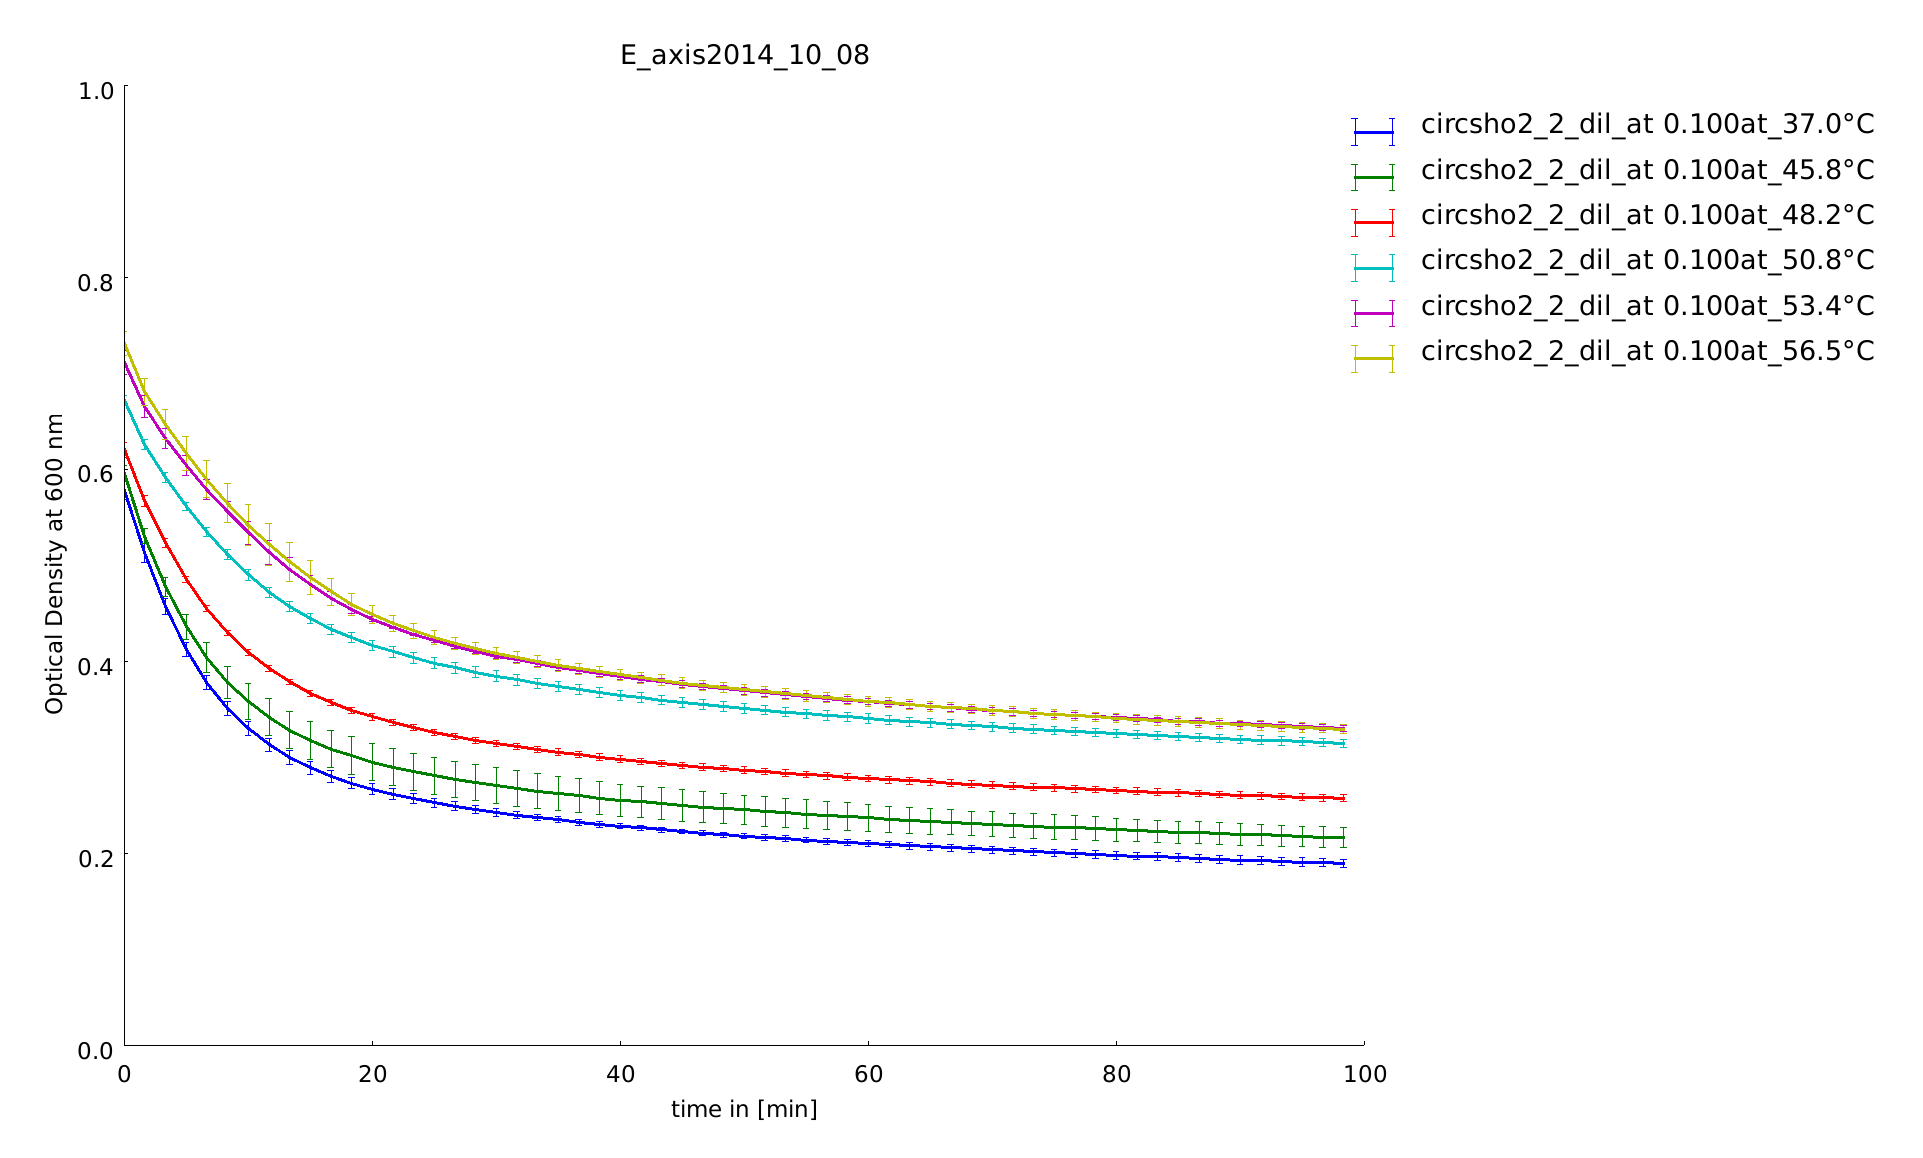
Lysozyme assay with linker sho2 with a heat shock span between 45.8°C and 56.5°C. You can see very clearly a difference between the temperatures.
| Predicted linker quality | Amino acid sequence |
|---|---|
| Very good linkers | |
| sgt2 | GGAEAAAKAAAHPEAAEAAAKRGTCWE |
| rigid | GGAEAAAKEAAAKAAPRGKCWE |
| Average linkers | |
| may1 | GGAEAAAKEAAAKAAAAHPEAAEAAAKEAAAKAKTAAEAAAKEAAAKARGTCWE |
| ord1 | GGAEAAAKEAAAKATGDLAAEAAAKAARGTCWE |
| ord3 | GGAEAAAKEAAAKASLPAAAEAAAKEAAAKRGTCWE |
| Short linkers | |
| sho1 | GGRGTCWE |
| sho2 | GGAEAAAKRGTCWE |
| Flexible linker | |
| flex | GGSGGGSGRGKCWE |
Experimental procedure
Cloning of the expression constructs
The construct to express linear lambda lysozyme BBa_K1362011 was assembled by CPEC from PCR products of pSBX1K30 and phage lambda genome. The RBS BBa_K1362090 was added by primer overhangs. In order to create the construct to express linear lambda lysozyme with His6-tag and exteins, primers to linearize BBa_K1362011 between the lambda lysozyme coding sequence and stop codon and add BsaI sites at the ends were designed. An insert coding for the sequence GSHHHHHHSGRGKCWE (His6-tag + exteins) with overhangs corresponding to the overhangs caused by BsaI restriction of the vector PCR product was designed and ordered as DNA-oligos. The insert was annealed and inserted into the purified PCR product of BBa_K1362011 by Golden Gate assembly.
The constructs to express circular lambda lysozyme with a rigid linker (BBa_K1362013), a His6 linker (BBa_K1362012) and all other linkers in shown in table 1 are based on the NpuDnaE intein RFC(105) circularization construct. These cloning steps were carried out according to our new RFC[105].
For BBa_K1362013 and BBa_K1362012, the coding sequence of lambda lysozyme without start and stop codon was aquired from genomic lambda DNA by PCR. Overhangs containing a BsaI site, the RFC[105] E standard overhang, the coding sequences of the extein CWE (forward) and the corresponding linker sequence, RGK, the RFC[105] B standard overhang, a BsaI site (reverse) were added by primers. The PCR products were purified and inserted each into the NpuDnaE intein RFC(105) circularization construct by Golden Gate assembly.
For the constructs with the linkers sgt2, may1, ord1, ord3, sho1, sho2 and flex, a cloning intermediate containing both lambda lysozyme and the selection marker ccdB instead of the mRFP selection marker was created by Golden Gate assembly of NpuDnaE intein RFC(i) circularization construct and two inserts with subsequent religation. The first insert was created by a PCR of the coding sequence of lambda lysozyme without start and stop codon aquired from genomic lambda DNA. Overhangs containing a BsaI site, the RFC[105] E standard overhang, the coding sequences of the extein CWE (forward) and a BsaI site (reverse) were added by primers. The ccdB insert was created by PCR of the ccdB selection marker from pDONR. Overhangs containing a BsaI site, the last 4 nucleotides of lambda lysozyme (forward) and the RFC[105] B standard overhang and a BsaI site (reverse) were added by primers. Inserts coding for the linker sequences with overhangs corresponding to the overhangs caused by BsaI restriction of the cloning intermediate were ordered as DNA-oligos. The linker inserts were annealed and inserted to the cloning intermediate by Golden gate assembly.
Expression and detection of circular lysozyme variants

All samples are active and not degraded.
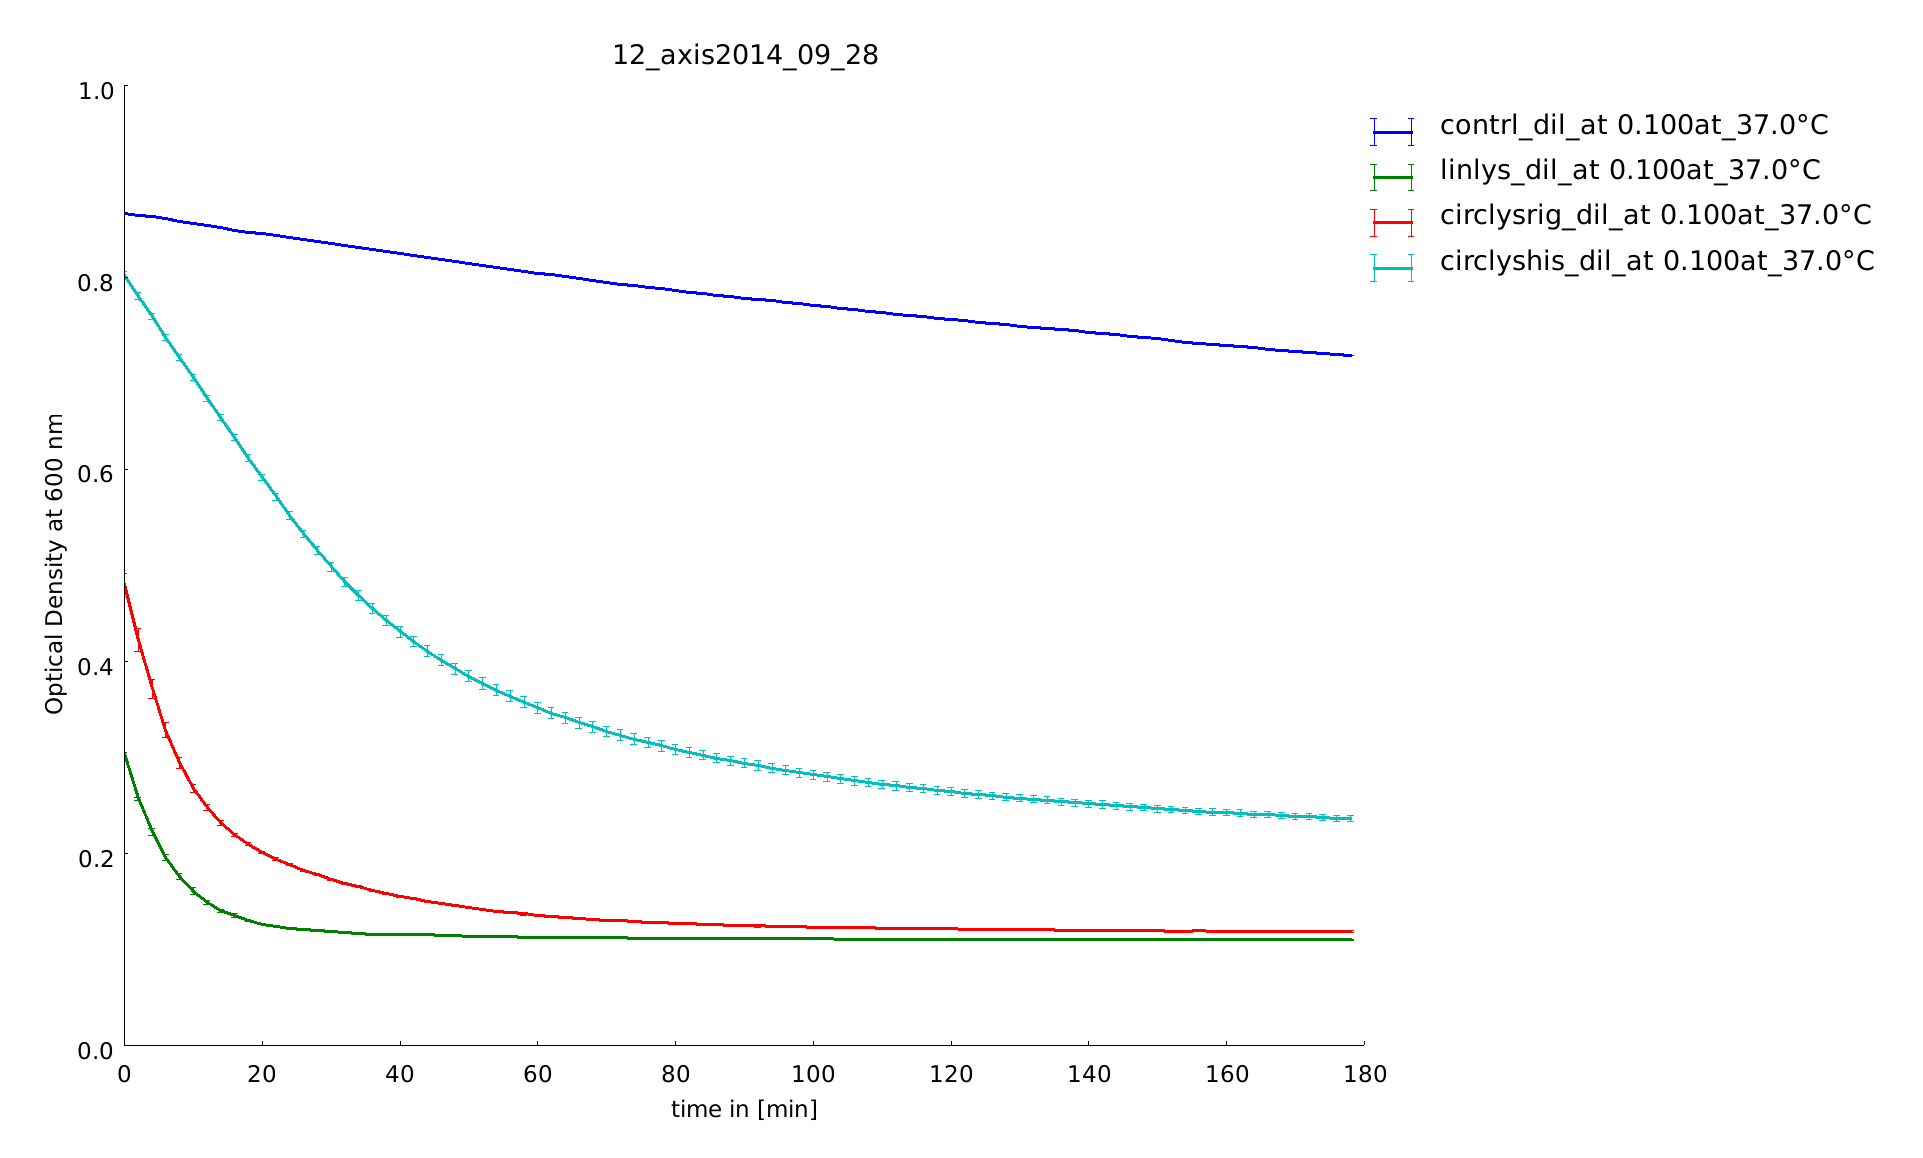
There is a difference between the activity of the lysozyme samples.
Because of the high expression level, tested with a Coomassie Gel (figure 3), we did not purify the lysozyme constructs and used non-purified protein mix. On the gel in figure 3 one can see that there is a difference between the expression level of the different constructs. But all constructs were expressed enough to measure their activity. To make sure our lysozyme samples were not degraded by proteases we measures samples two times, direct and after 20 hours at 37°C. But the activity persisted on the same level (figure 4 and 5).
The linker screening was performed with ten different linkers. We wanted to show that different linkers have different effects on the thermostability and function of a protein, as claimed by our Linker-Modeling. The linker software calculated linkers classified according to fitness as great, bad, short and proper linker. The length of a linker had a significant effect on folding structure of proteins.
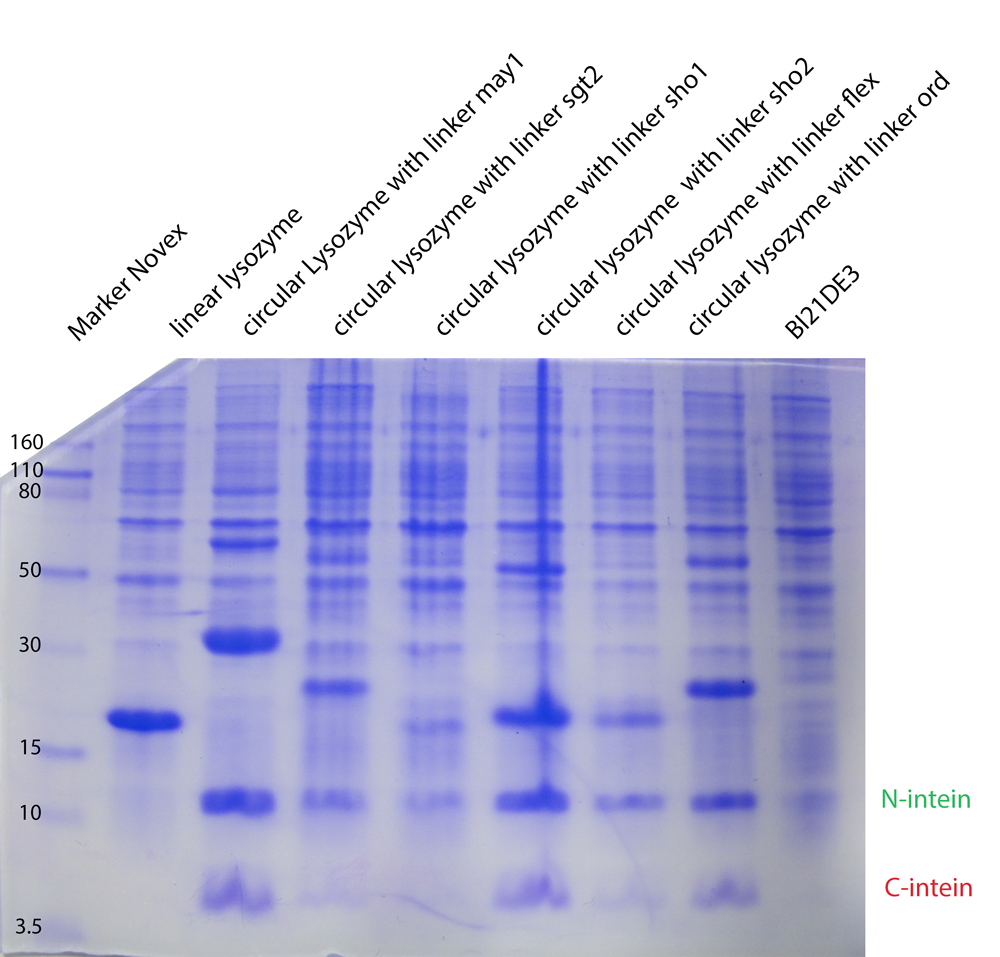
The expression levels of the linker constructs are different. In all lanes you can see intein fragments as result of the trans-splicing reaction.
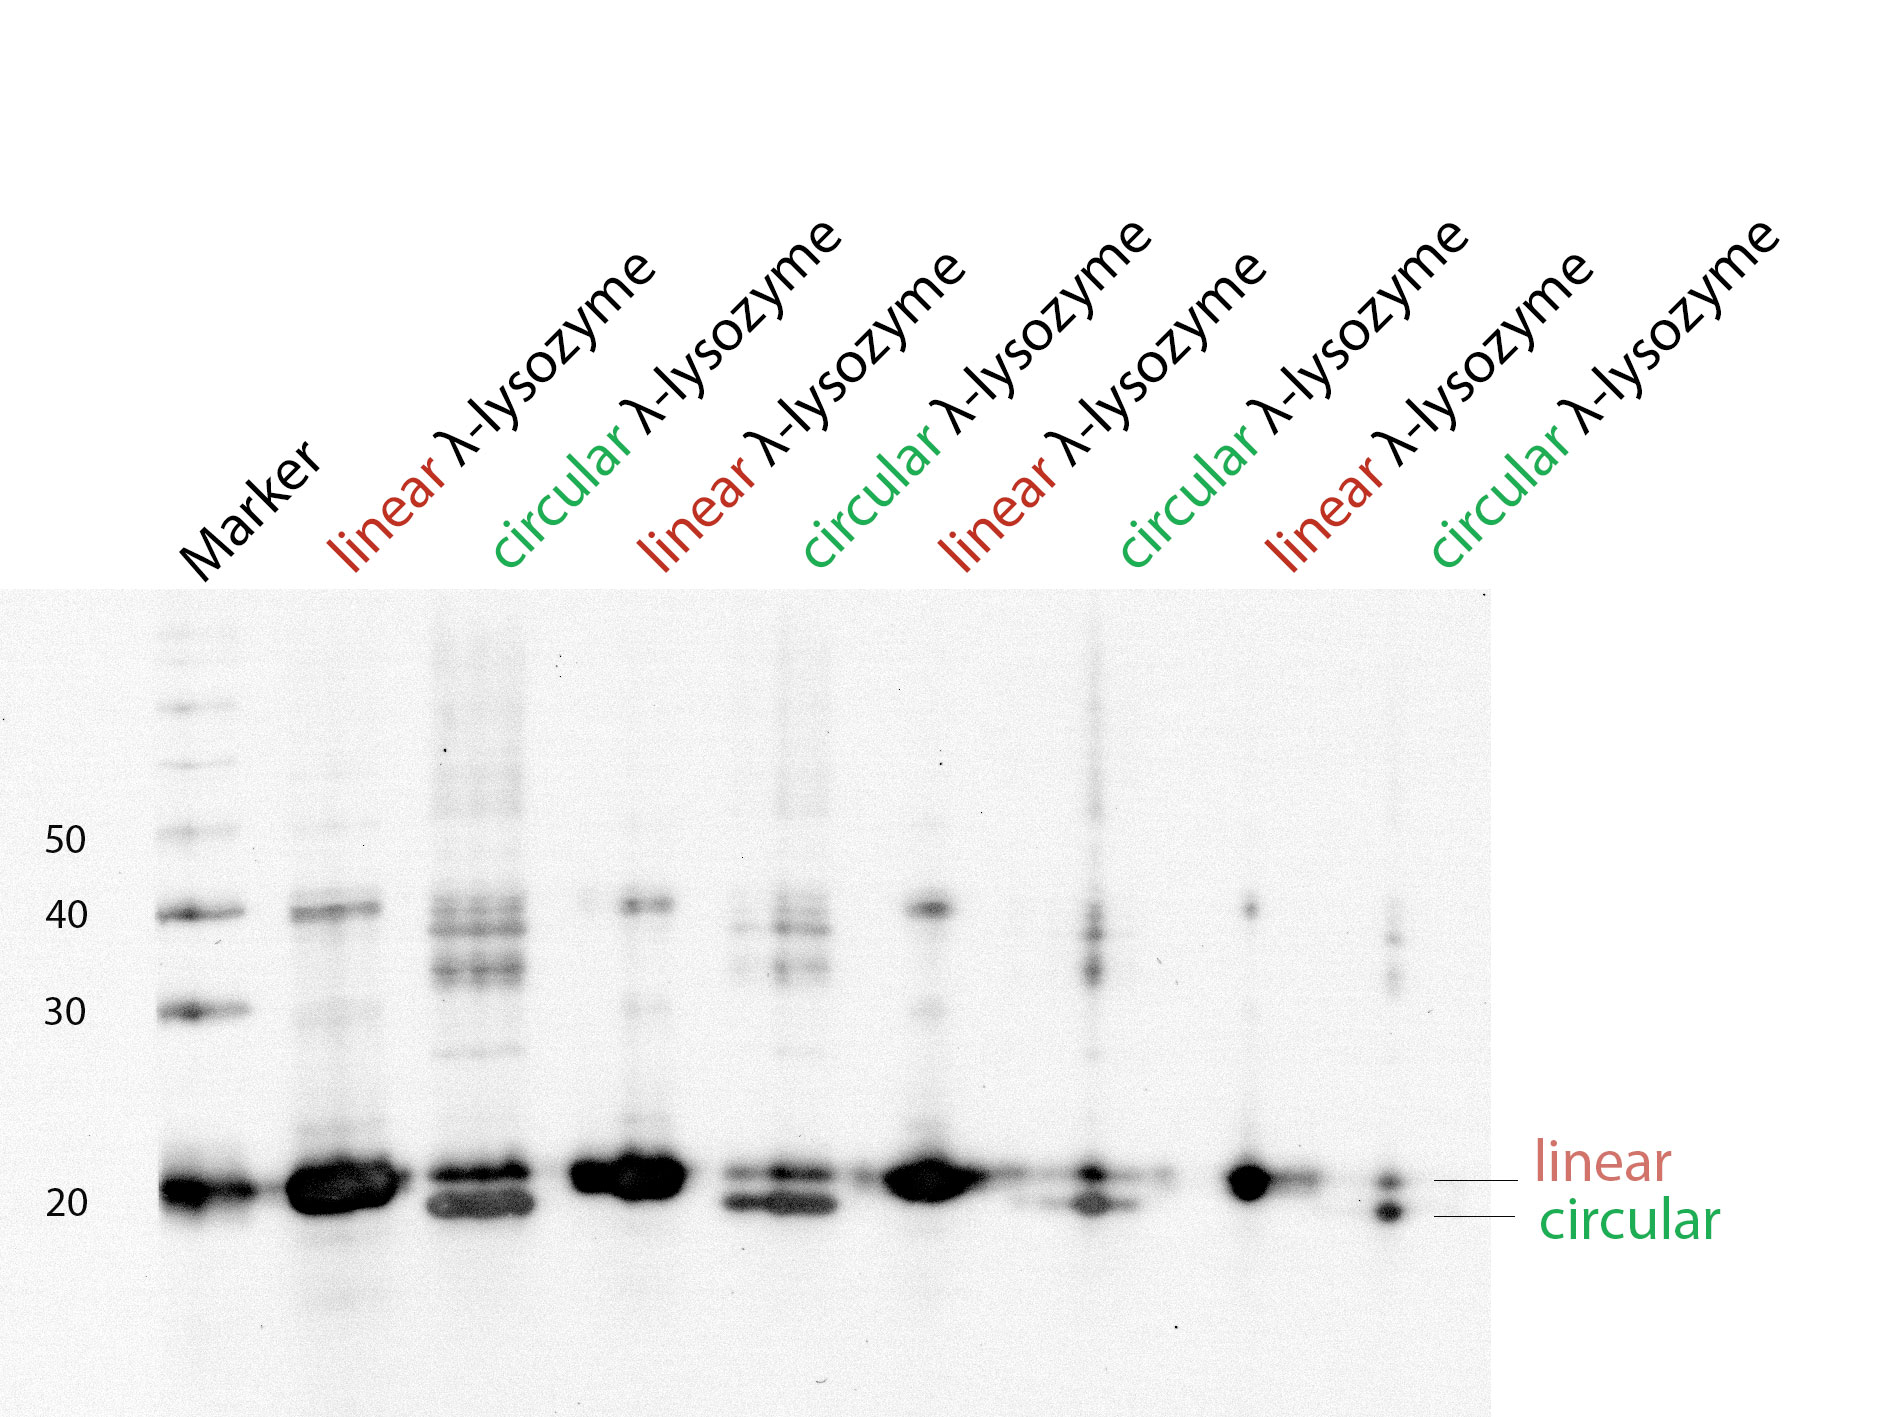
To test if lambda lysozyme is circular after the splicing reaction of the intein Npu Dna E we did a Western Blot with Penta·His Antibody. There is a clear shift between linear and circular samples.
Development of assay to measure lysozyme activity
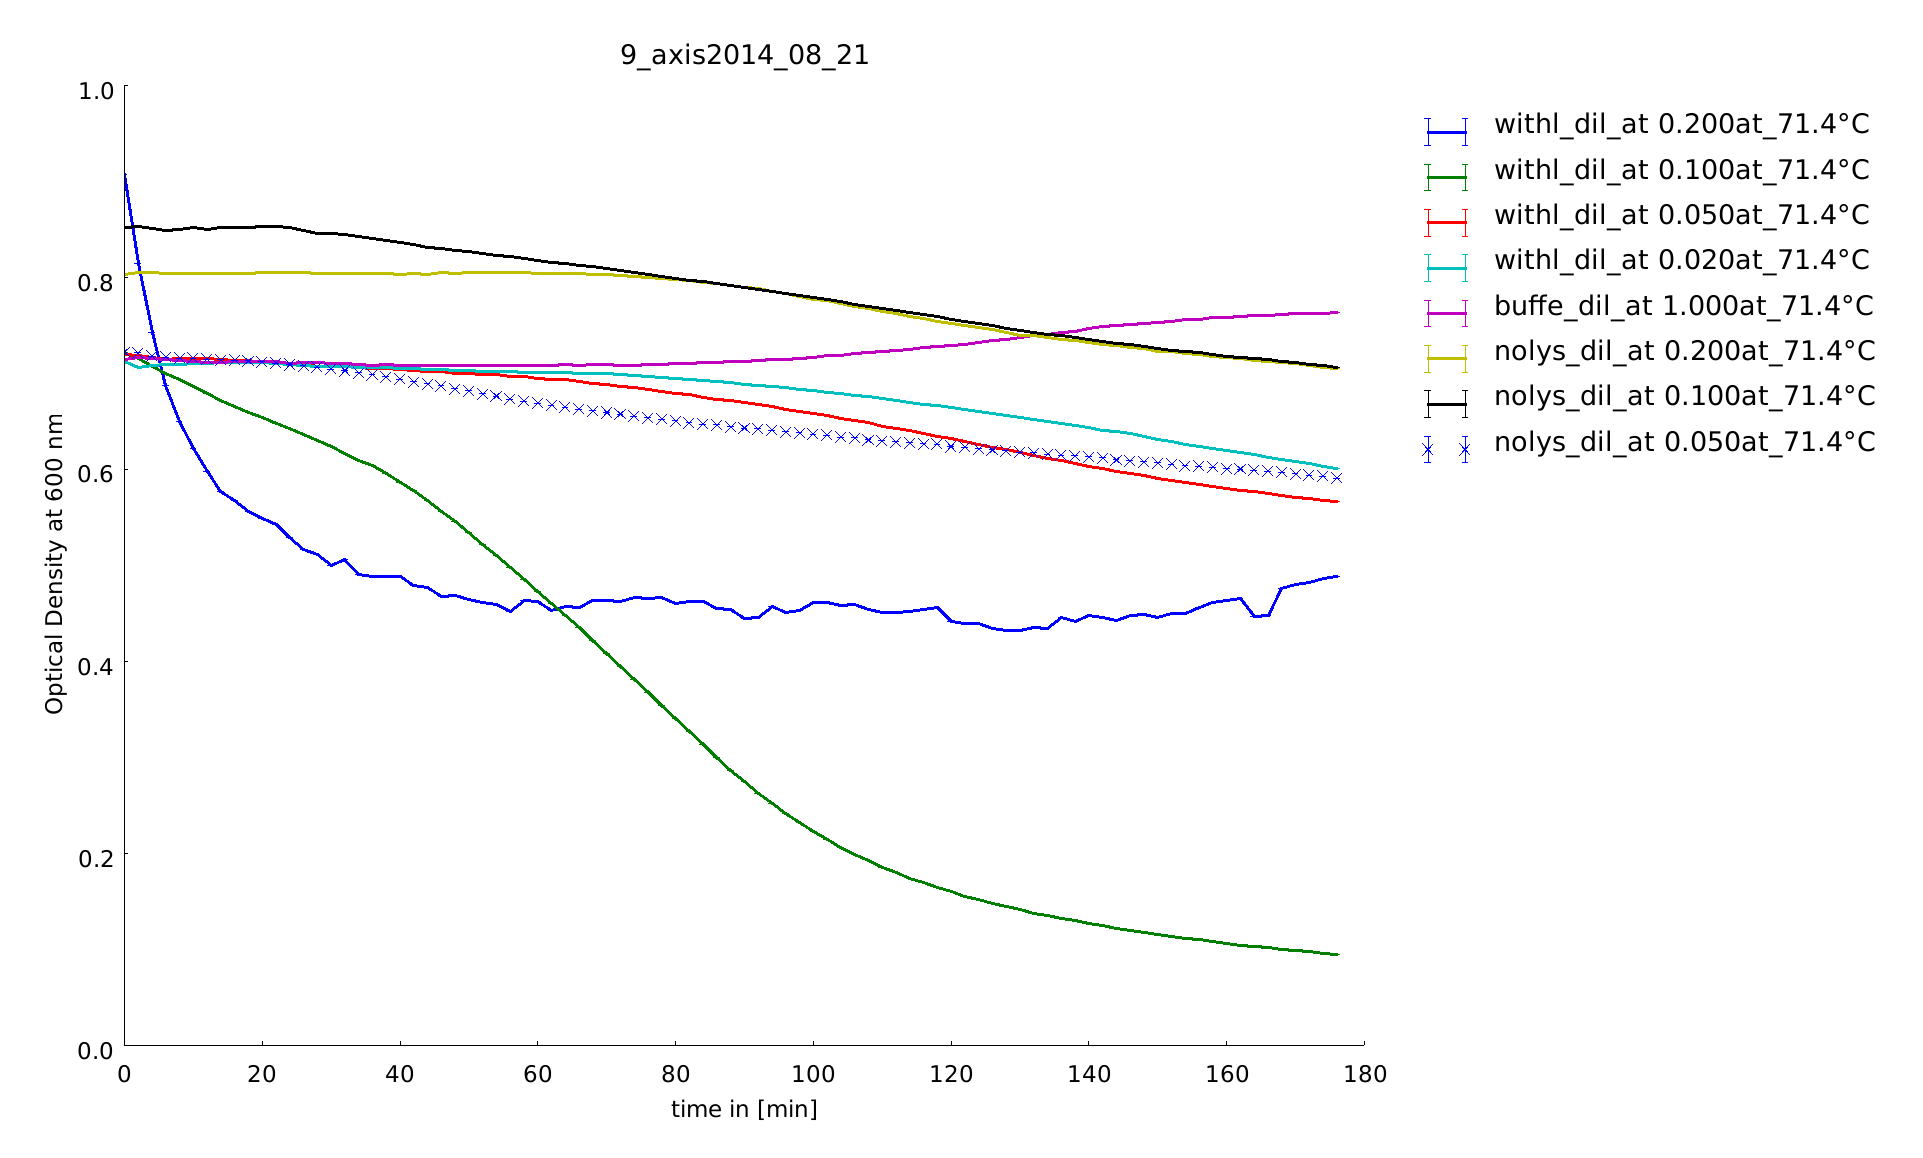
To test and quantify the differences in thermostability of the linear and several circular forms with different linkers of lambda lysozyme we needed an assay that is simple and reproducible enough. To have a comparison and a great check on functionality we tested two different methods to measure lysozyme activity and established the range of temperature to test the heat stability of the enzyme. Lysozyme of the bacteriophage lambda like the other lysozymes cleaves glycosidic bonds between 1,4-beta-linkages between N-acetylmuramic acid (NAM) and N-acetyl-D-glucosamine residues (NAG) in peptidoglycan and between N-acetyl-D-glucosamine residues in. As a really small protein built of only 158 amino acids its mechanism is different from other lysozymes: the hydroxyl function OH on the C6 of the muramic acid is the nucleophile on cleavage of the muropeptide instead of the more common water molecule. So the protein is a transglycosidase, not a hydrolase [4]. The scientific background of the first assay was the capacity of lambda lysozyme to degrade the cell wall of Micrococcus lysodeikticus, a gram-positive bacterium often used as a lysozyme substrate [5]. The rate of lysis of Micrococcus lysodeikticus was measured by a change of OD of the substrate solution at 600 nm. Using 96-well plates we have the possibility to test on several constructs within one assay.
The basis of the second assay was the labeling of peptidoglycan with fluorescein isothiocyanate (FITC), an amine-reactive derivative of fluorescein dye. When the FITC-labeled substrate was subjected to the enzyme digestion, an increase of fluorescence intensity and a decrease of fluorescence polarization value should be observable. The labeling of peptidoglycane was done by ourself [6].
Performing both assays we realized in an early state that the first assay is less error-prone than the fluorescence intensity measuring assay. Both assays were measured in the plate reader Tecan Infinite F200 PRO. Even after several washing steps we could not exactly identify how effective the labeling was. Furthermore we had problems with the adjustment of the wavelength and the gain. The assay measuring the degradation of the substrate had disadvantages, too. Because of the substrate M. lysodeicticus there were unknown values we could not predict.
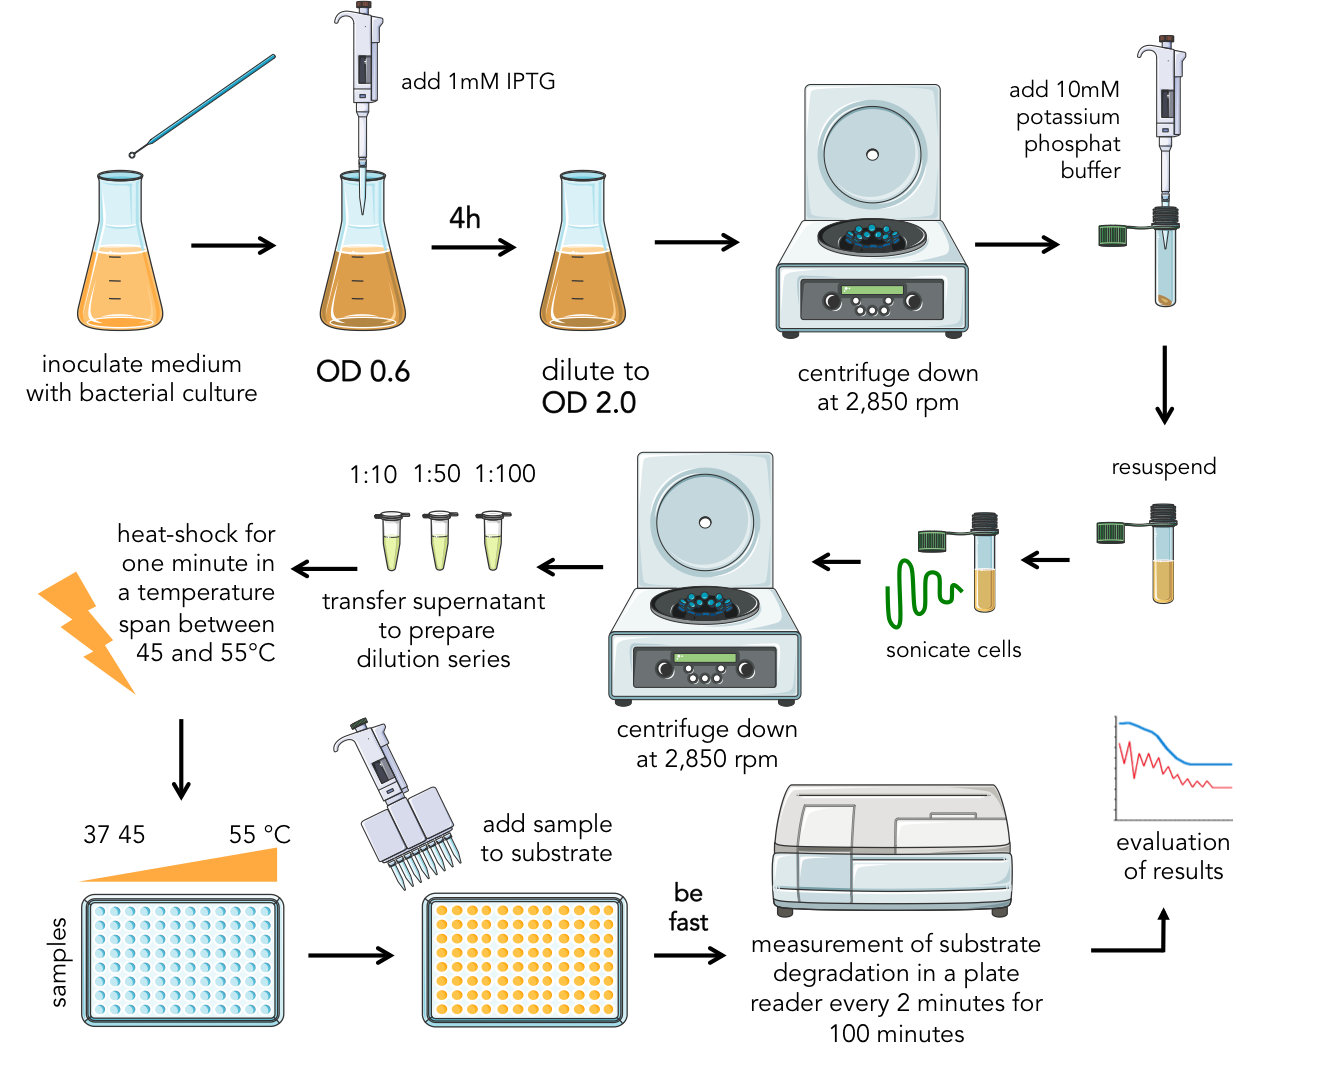
The degradation of the substrate and associated with it the decrease of the OD was measured every 2 minutes for two or three hours to get all kinetic information and recognize a potential refolding. At the beginning of the assay setup we measured the behavior of lambda lysozyme after a heat shock at temperatures up to 70°C until 90°C. Because of special characteristics of lambda lysozyme such as non-enzymatic behaviour around 70°C [7] we did not enhance the measurement due to higher temperatures. For the linker screening the samples were heated for 1 minute between 37°C and 57°C.
Focus of the assay is to test the heated protein on stability not on functionality. If the lysozyme still degrades the substrate and retains function it shows that the protein is still folded correctly. We measured the activity and associated the heat-stability of lambda lysosyme after a heat shock to see behavior of refolding. So the first minutes after heating are very important to see potential refolding. So the speed the assay were performed is critical, too.
Materials and Methods
Results
We have established a protocol with which one is able to make a quantitative analysis on the effect of different linkers heat stability of lysozyme. This method can not only be performed in large scale, but is also resistant to various influences, like different expression levels of the constructs. With this assay in short time sufficient data of high quality can be produced, so that an extensive enzyme modeling approach can be made for their evaluation.
For the evaluation the data of the degradation curves from the assays were analyzed for the change in activity after different heatshocks. This was done applying different models to the data and analyzing it by use of Profile Likelihood Estimation, like we described in our enzyme modeling part. To each degradation curve by itself we did not apply a complex model, but the advantage lies in modeling the data in total. The complexity lies in the combination of the different model parameters. The models were always fitted to the data of multiple experiments at once, leading to an increased reliability than fitting single data.
We could show, that the data was well described by applying product inhibited Michaelis Menten kinetics. Further on we found out, that the model's quality did not increase significantly by letting the enzyme kinetics ($K_M, K_I$) parameters change over temperature. This was done by making identifiability analysis of model parameters. We showed, that when not restraining $K_M$ and $K_I$ for different temperatures none of the important parameters was identifiable anymore. For better readability we introduced parameters representing the loss in activity after heat shock. These were called activities at a temperature and were built as the ratio between $V^T_{Max}$ and $V^{37°C}_{Max}$. These parameters were the most interesting ones for us. When each lysozyme was modeled with constant $K_M$ and $K_I$ for different temperatures nearly the activities were identifiable within 95% confidence level. For some very good datasets even the kinetic parameters $K_M$ and $K_I$ could be identified on a lower confidence level. Therefore we concluded that the change in these parameters for the different temperatures was minor and could be neglected in the further evaluation.
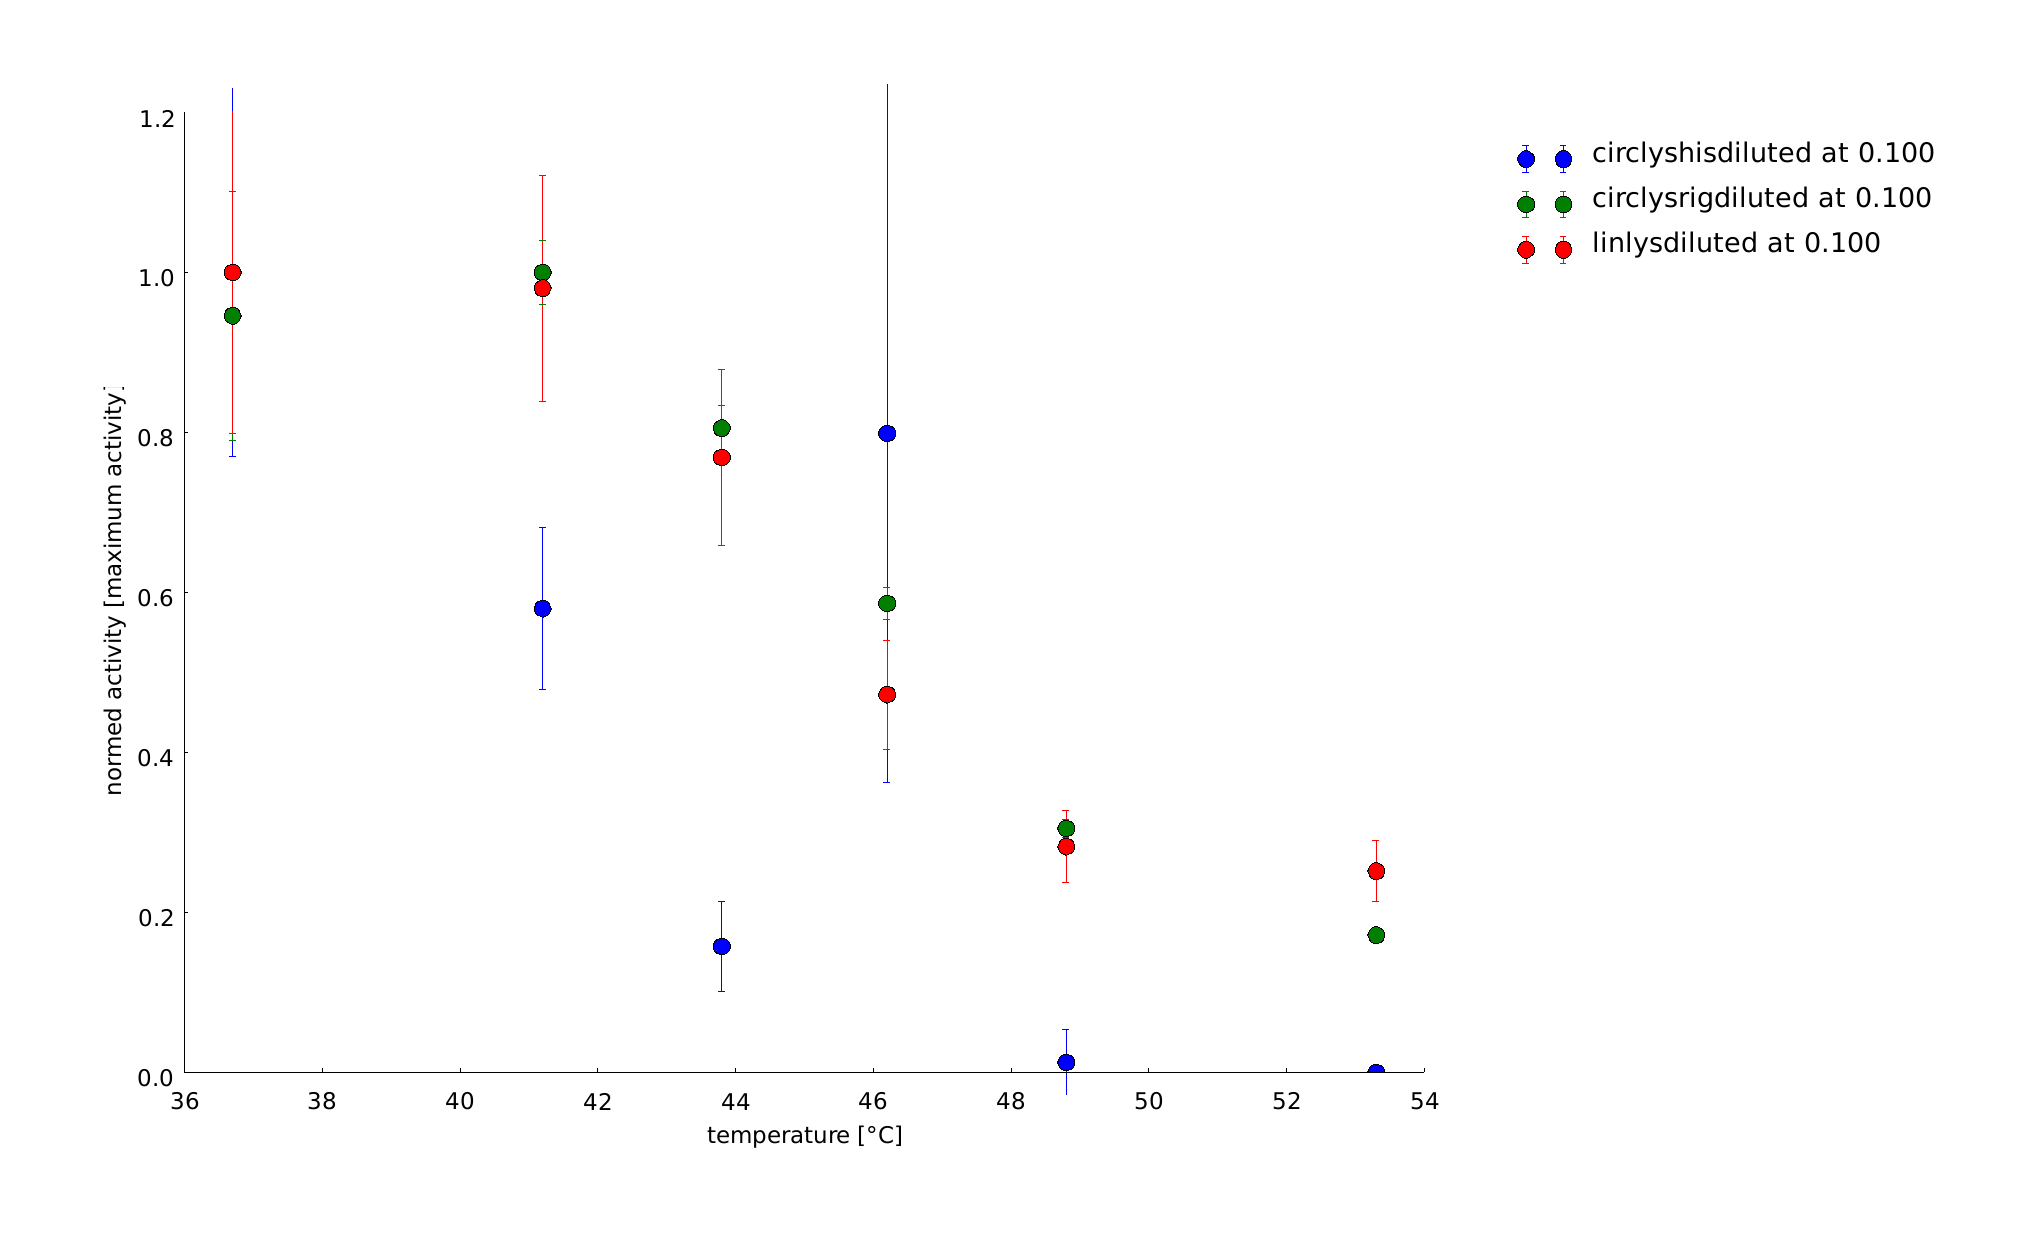
We showed that the different linker constructs show different changes in activity after heat shock, figure 7.

Ratio of activity after a heatshock of a certain temperature. The single points come from different technical and biological replicates. For clarification a simple spline was fitted to the data. The fits produced 95% confidence intervals, that would exceed the scale. But as on can see that mostly the different replicates don't scatter too much, these errors are not too relevant. A clear difference can be seen for ord1- and ord3-linker in comparison to the flexible linker and the linear lysozyme
For further clarification we have calculated the average activity between 45 and 50°C, because there the biggest change in activity could be observed for the different constructs. Furthermore the values of the activities vary a lot, what can especially be seen at circsho1 linker. This averaging was made for clarification and for obtaining a final ranking of the linkers to feed back to the linker software (see table 2)
| Linker | classification | average activity from 45°C to 50°C |
|---|---|---|
| ord3 | Average | 1.390 |
| ord1 | Average | 0.956 |
| rigid | Very good | 0.945 |
| may1 | Average | 0.749 |
| sgt2 | Very good | 0.748 |
| sho1 | bad | 0.709 |
| linlys | linear | 0.704 |
| flex | Flexible | 0.685 |
| sho2 | bad | 0.574 |
Discussion
Our Linker screening was the first time that rigid linkers with angles were tested on their effect on thermostability. Further on we could extract the relevant data to calibrate CRAUT software with the results. Still important enzymatic parameters could not be identified reliably. Due to the lack of time the amount of replicates was restricted. Mainly the time between adding the enzyme to the substrate and the first measurement influences the quality of the data. Further refinement there could lead to better identifiability of the parameters. The errors on the parameters obtained from the fitting would need to be reduced. On the other hand one is tightly limited in the initial substrate concentration in a range until 0.7 mg/ml, which makes it difficult to identify all the parameters. Further on the linkers could be tested with different proteins to make predictions more independent of the protein.
The long way to setup the assay
Enzyme kinetics and protein interactions are very complex fields of modeling and biochemistry. For the present assay, there were many different dimensions that has to be tested and optimized: concentration of enzymes, of substrates, temperature for the enzyme-substrate reaction, heat shock temperature and length, as well as length of recovery after heat shock. So we had to test many factors, solve many problems and find new ways to establish our linker screening to a standardized and ideal method for testing the effect of different linkers on proteins. The following part details the establishment of our assay. The main issues were finding the correct temperatures, the correct lengthes of heatshock and the right concentrations.
14th of August
In the first assay we used HEWL (ordered from Sigma Aldrich) and E.coli lysate without lysozyme to see how lysozyme behaves in general and how the assay works in total. Furthermore we wanted to see a difference between HEWL containing samples and E.coli lysate. All samples were heated from 70°C to 90°C in the cycler. The results of this first test were curious. It seems that even without lysozyme and without E.coli lysate, the substrate is degraded.
17th of August
Repeating the first assay we could improve the results and saw first temperature dependence. This assay did not give great results, too. But we figured out that the concentration of HEWL was too high, which might explain the behavior of the samples, because at the higher temperatures we observed big coagulation. Furthermore we mentioned that we are too slow preparing and performing the assay, as most of the substrate is already degraded, when we had the first measurement. The most information about the enzyme kinetics can only be seen in the degradation of the Micrococcus lysodeicticus in the very first minutes.
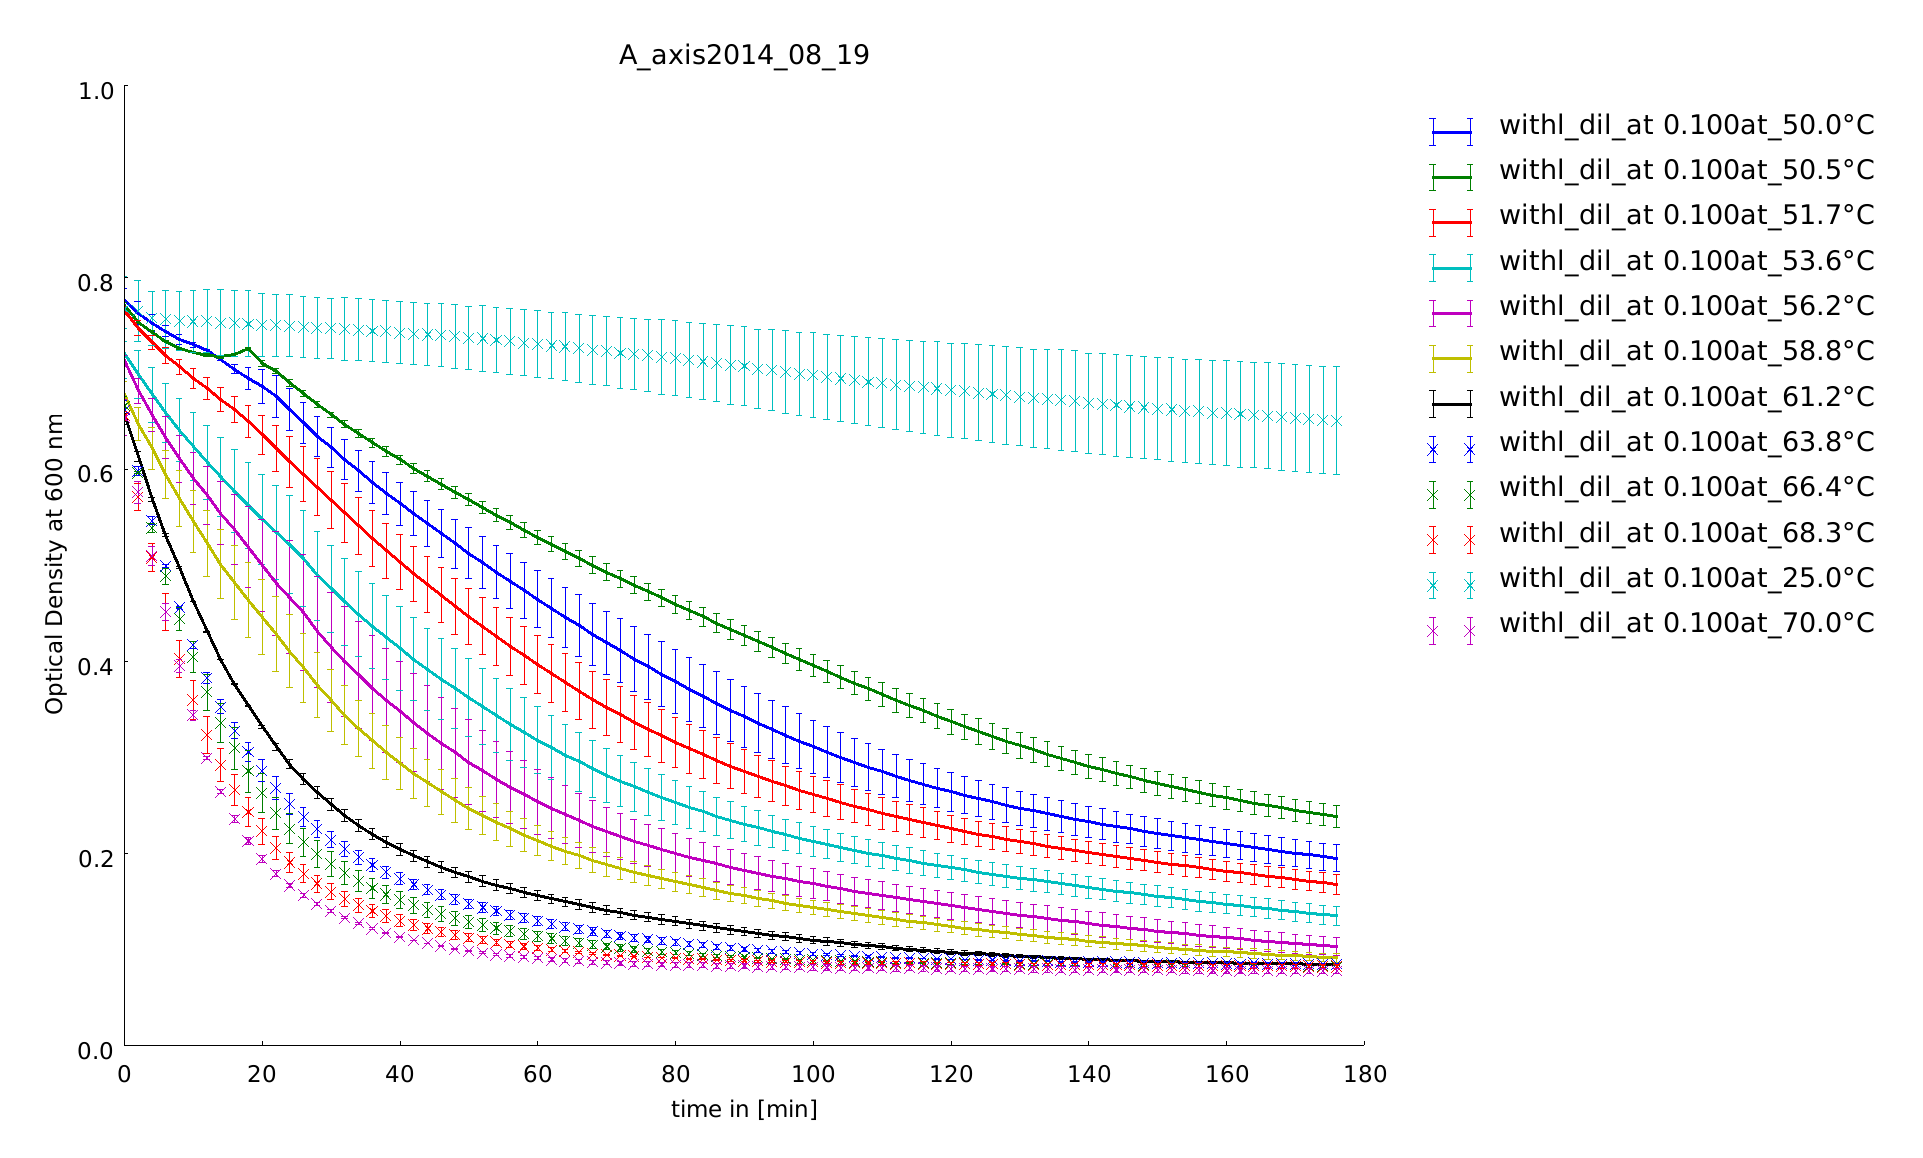
19th of August
After using HEWL in the last assays we now tested a linear lambda lysozyme construct we had cloned and expressed the weeks before. The samples were heated at a different temperature span between 50°C and 70°C. This was the first time we really could see different curve progressions after a heat-shock at different temperatures. We changed our method, so that we were faster in the platereader after adding the lysozyme. The sobering message: The activity grows with higher temperature.
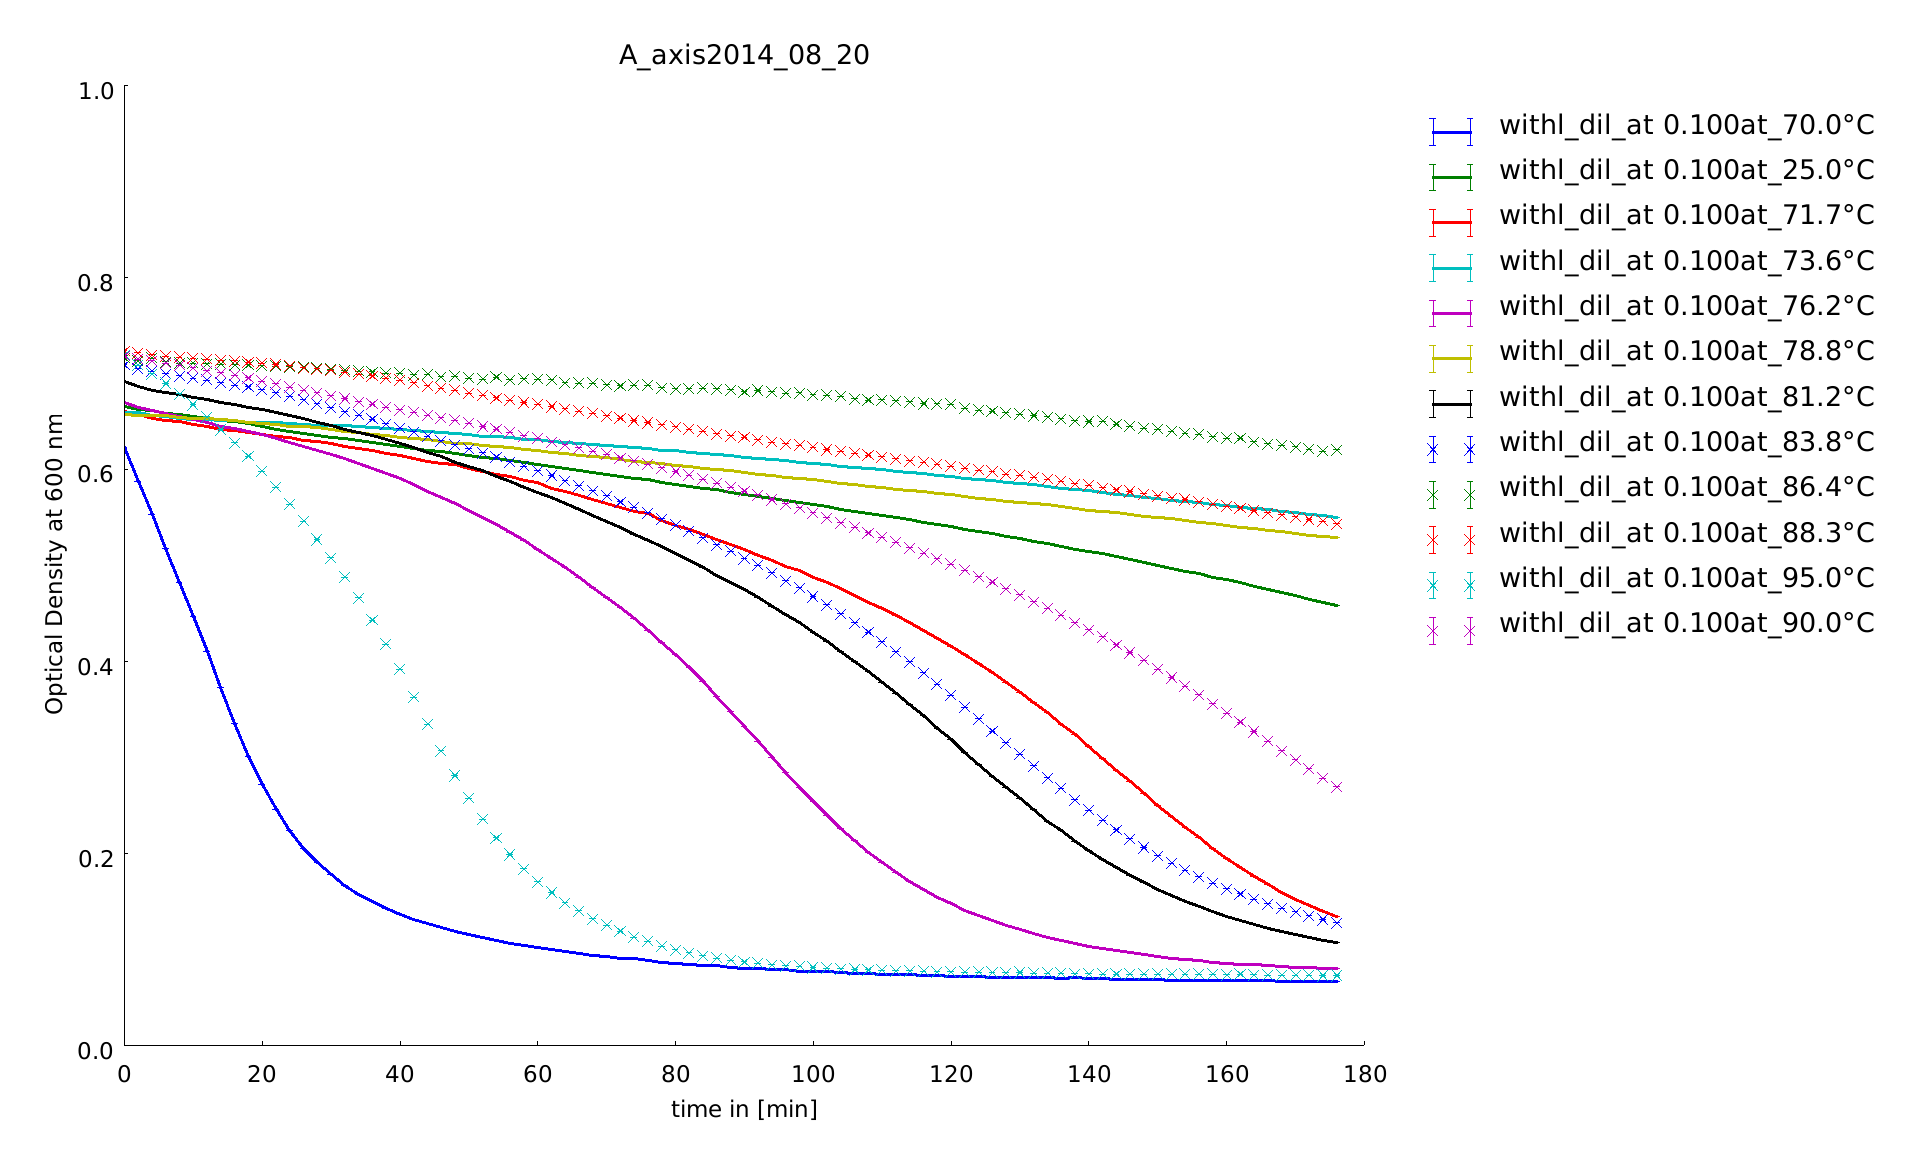
20th of August
To explain the behavior of the lysozyme around 70°C we saw in the last assay we measured the degradation of substrate after a heat-shock in a temperature span between 70°C and 95°C. It seems that lysozyme has his highest activity around 70°C. Later we detected that lysozymes has a non-enzymatic activity [7], which explains the increase of activity around 70°C. Controls containing no lysozyme did not show any activity. All graphs showed "shoulders" and not a clean exponentiell curve. Troubleshooting possibilities like salt, measuring temperature had to be checked before performing the next assay.
21st of August
To find out the best concentration of the lysate we measured a dilution series. High concentrated samples were coagulating, protein lysate less diluted did not showe this effect. It was the first time we saw a significant activity of lysozyme at 37°C. The 1 to 10 dilution is seems to be the appropriate dilution, because activity was high enough.
22nd of August
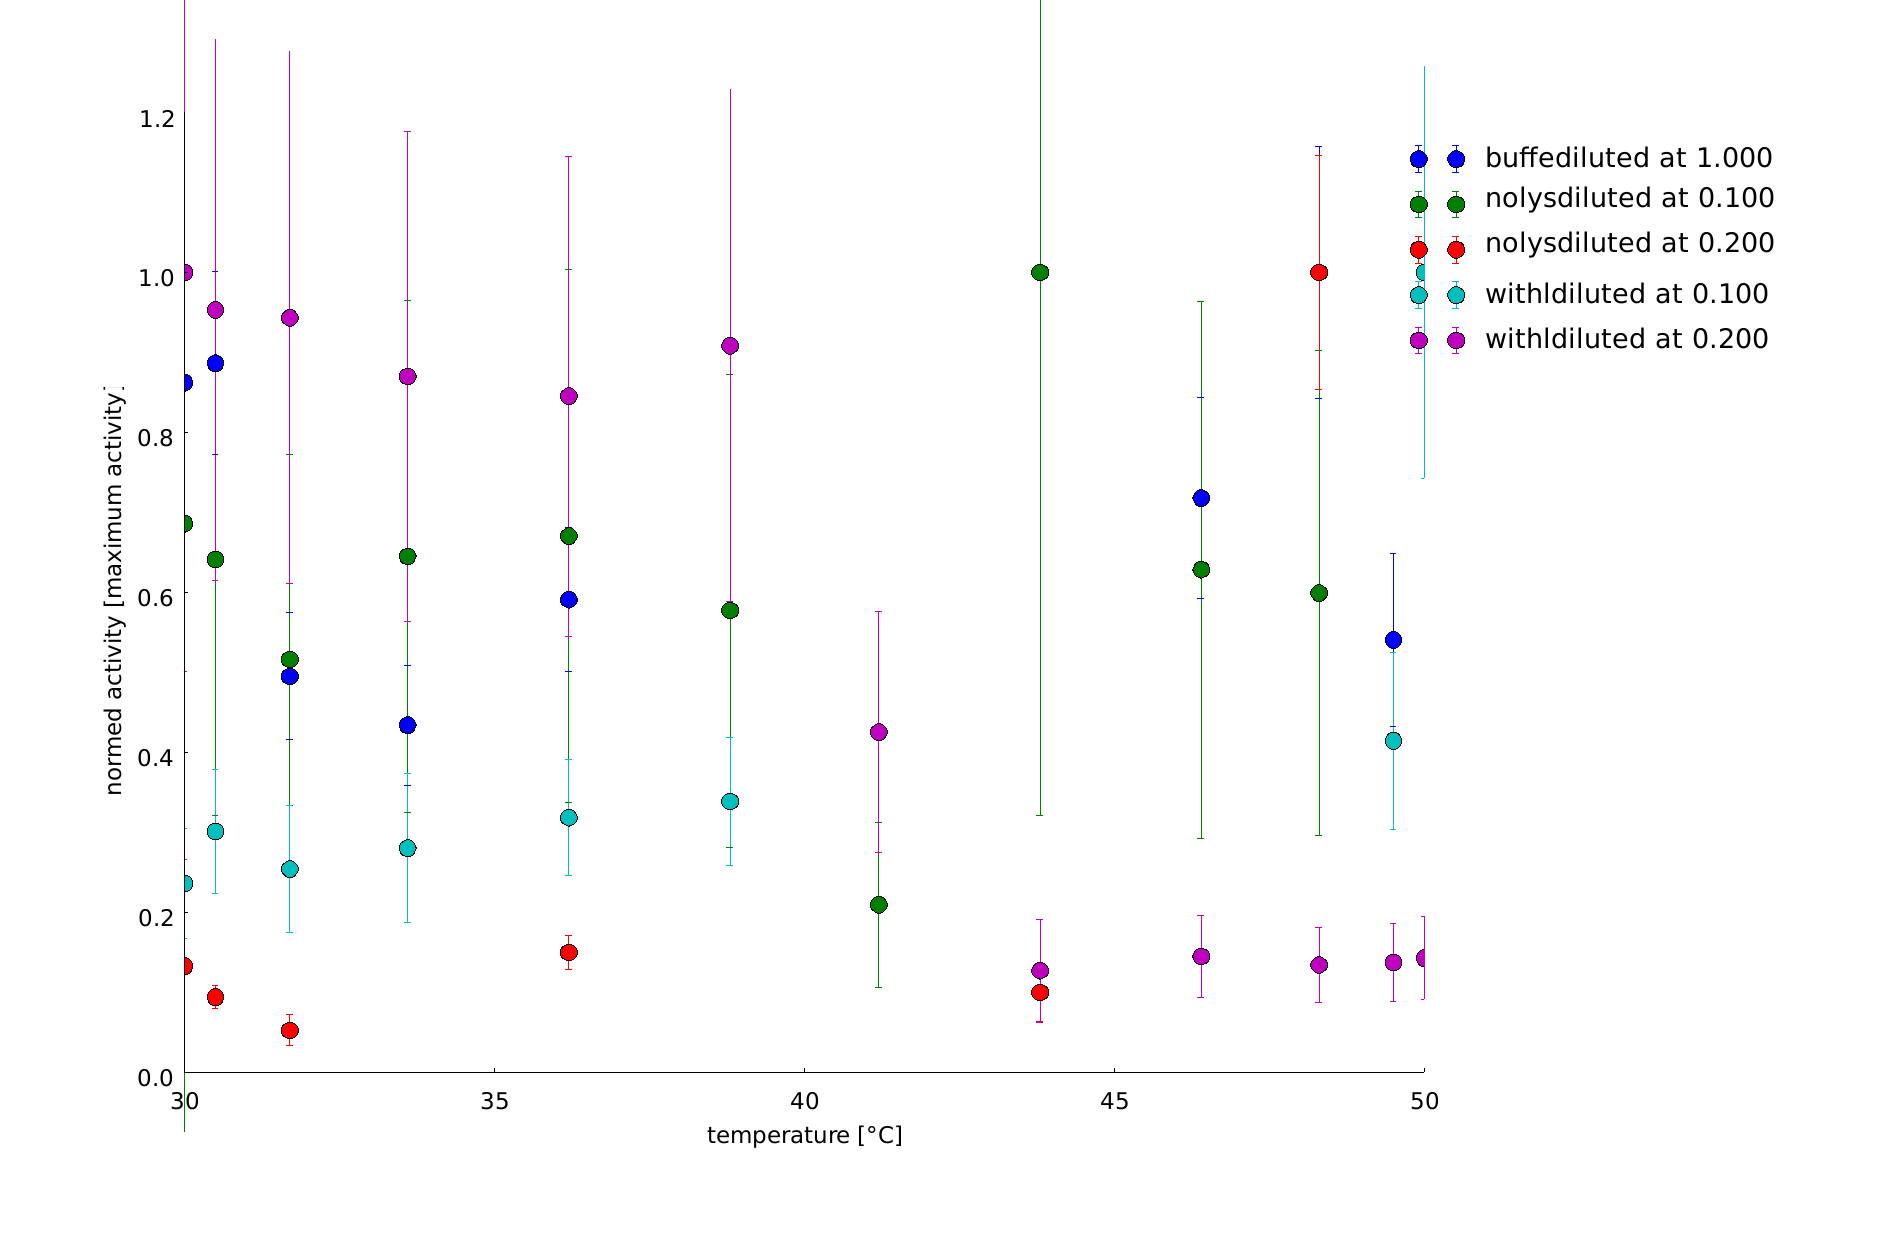
Testing lower temperatures we decided to do a heat shock at temperatures between 30°C and 50°C. The activity of lambda lysozyme decreases until 50°C, the maximum activity samples showed that were heated at lower temperatures.

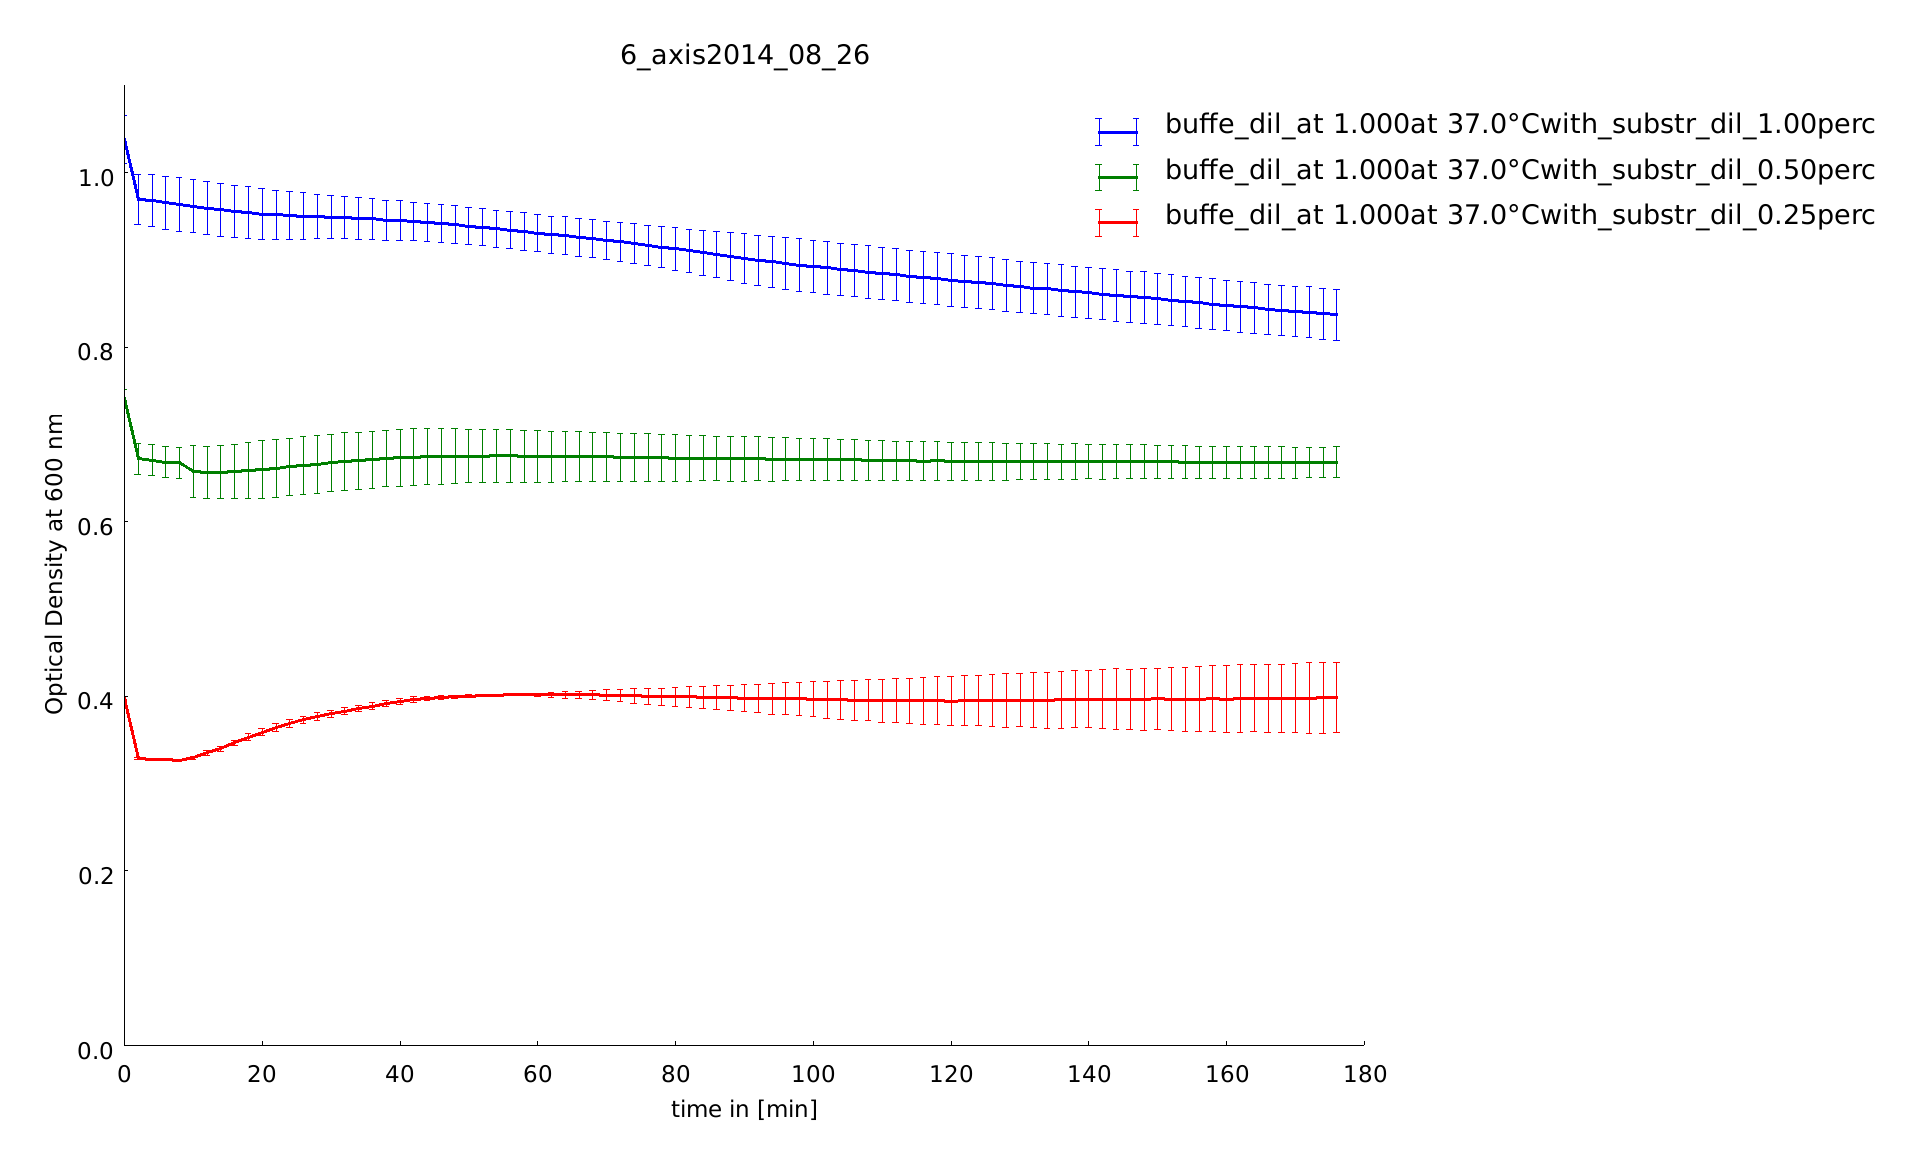
26th of August
Next to enzyme dilutions we tested substrate dilutions to. All constructs were kept on 37°C, even during the measurement the plate reader had this temperatur. We found out the perfect concentration for the substrate, next assays were done with 0.5 % (w/v). With lower concentrations the errors were large.
30th of August
Next to the speed the accuracy of pipetting is significant, too. In this assay we payed heed to exact pipetting. Furthermore we measured many replicates on one well to check on correctness of pipetting. The differences between the replicates were low.
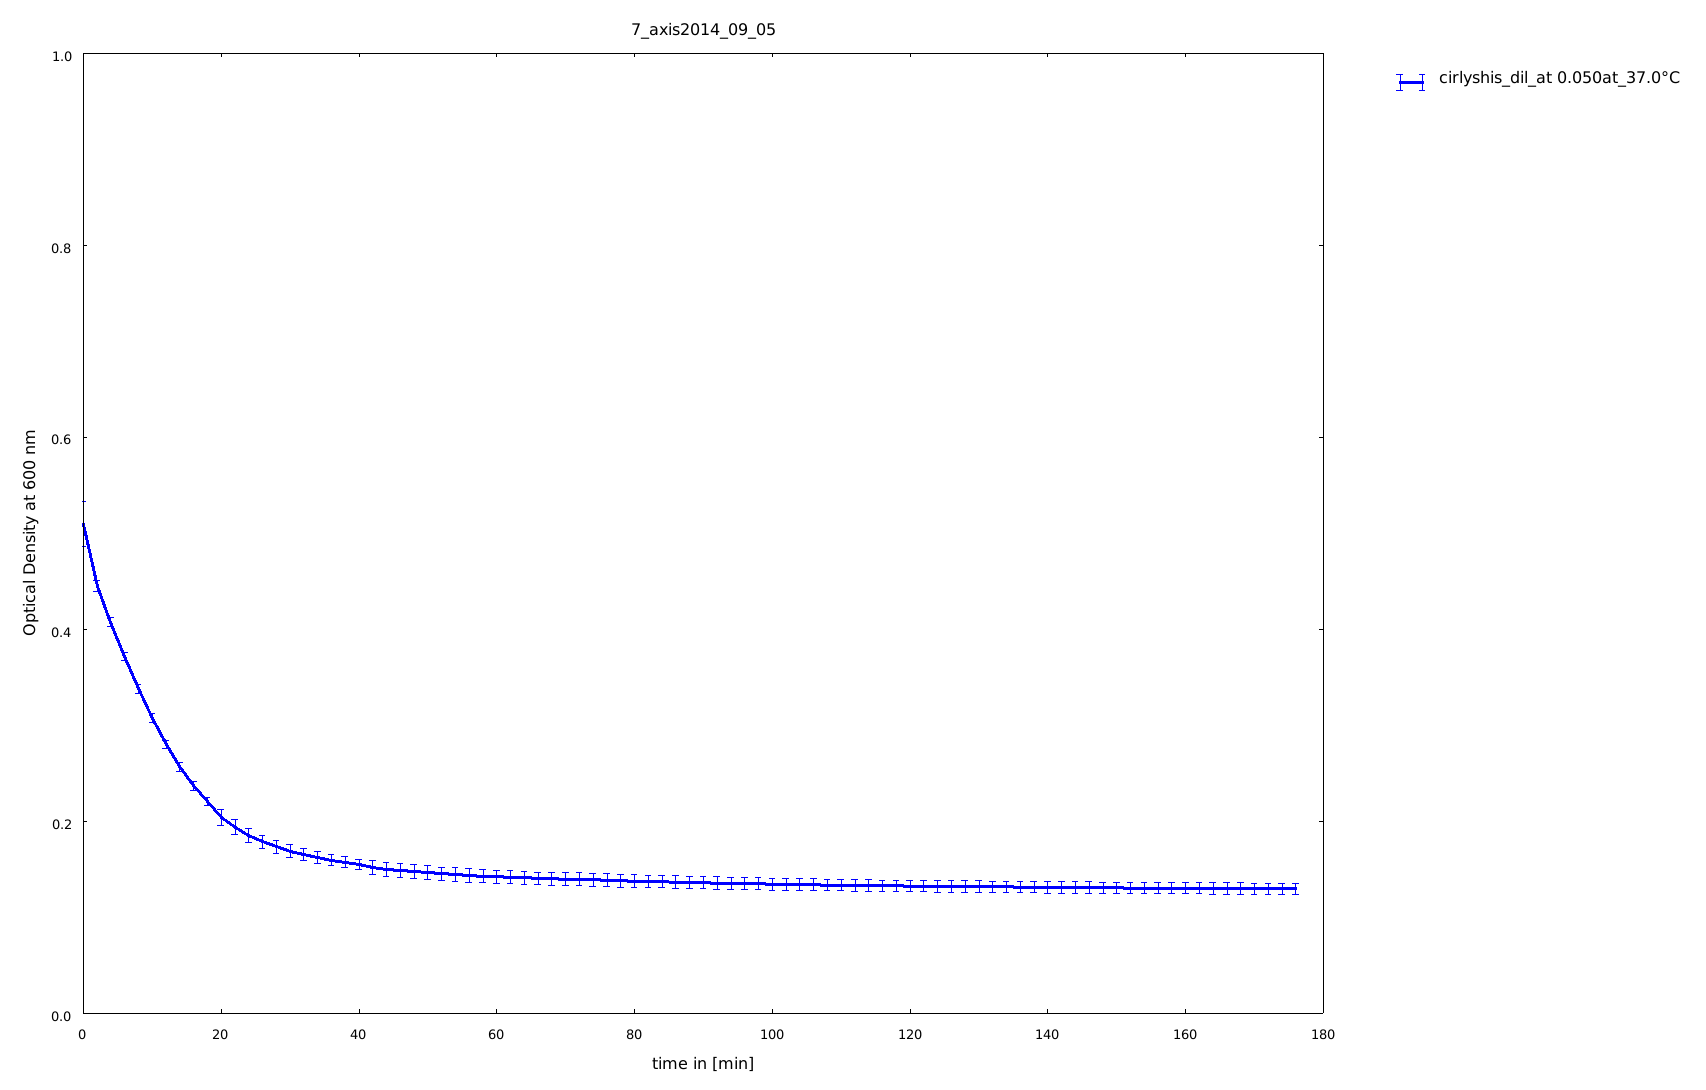
5th of September
The cloning of the circular form of lambda lysozyme was finished, so we tested this construct the first time to see, if the circular form of lysozyme is still active. Because it was the first assay with circular constructs, the rigid-linker construct and the His-linker construct, we did not heated them. All samples stayed on 37°C.
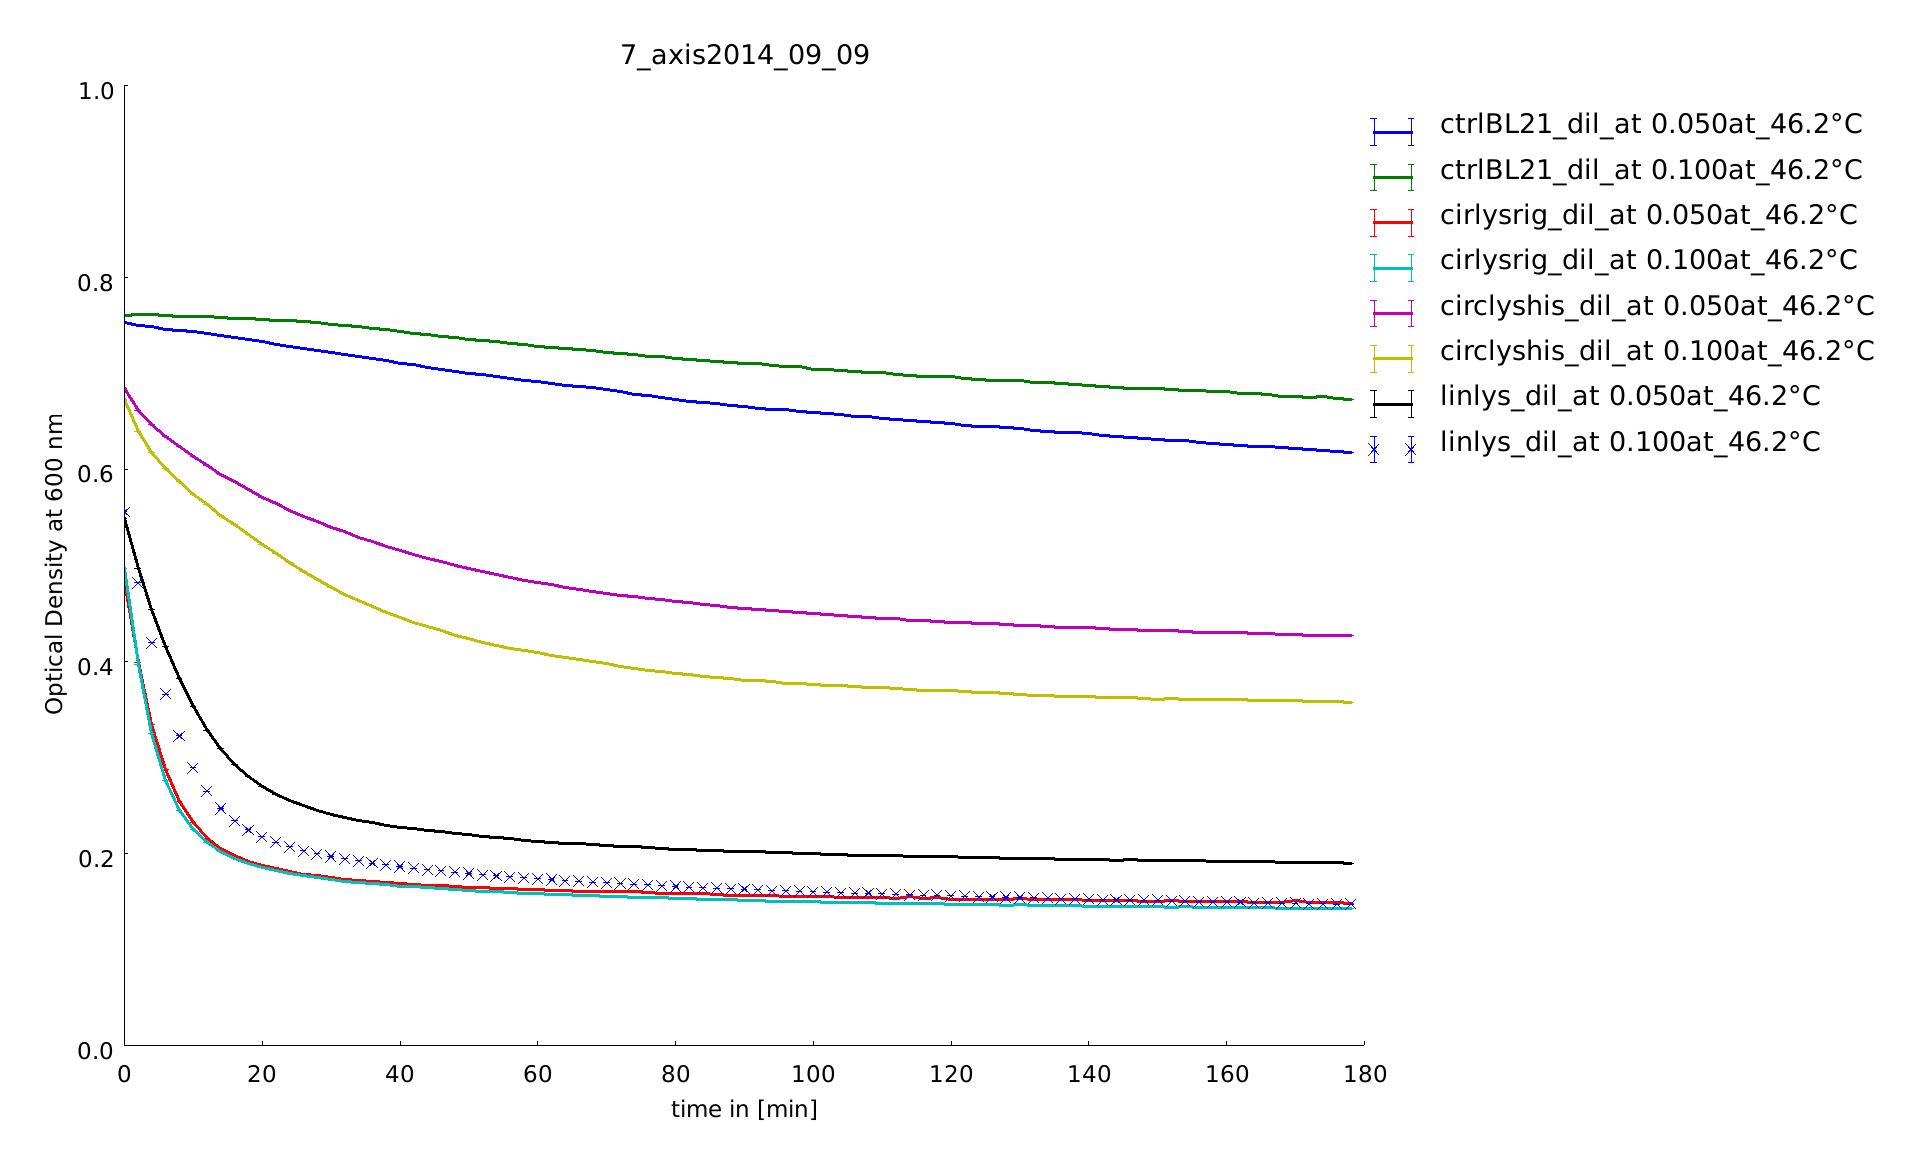
9th of September
Aim of this assay was to see differences in the temperature stability of the different lysozyme constructs, linear and circular, after a heat shock of half of an hour between 35°C and 55°C. The circular lysozyme constructs are clearly working and the probes with the rigid linker work better than the construct including a His-tag. Before declaring a difference between circular and linear constructs we needed more results for great statistics.
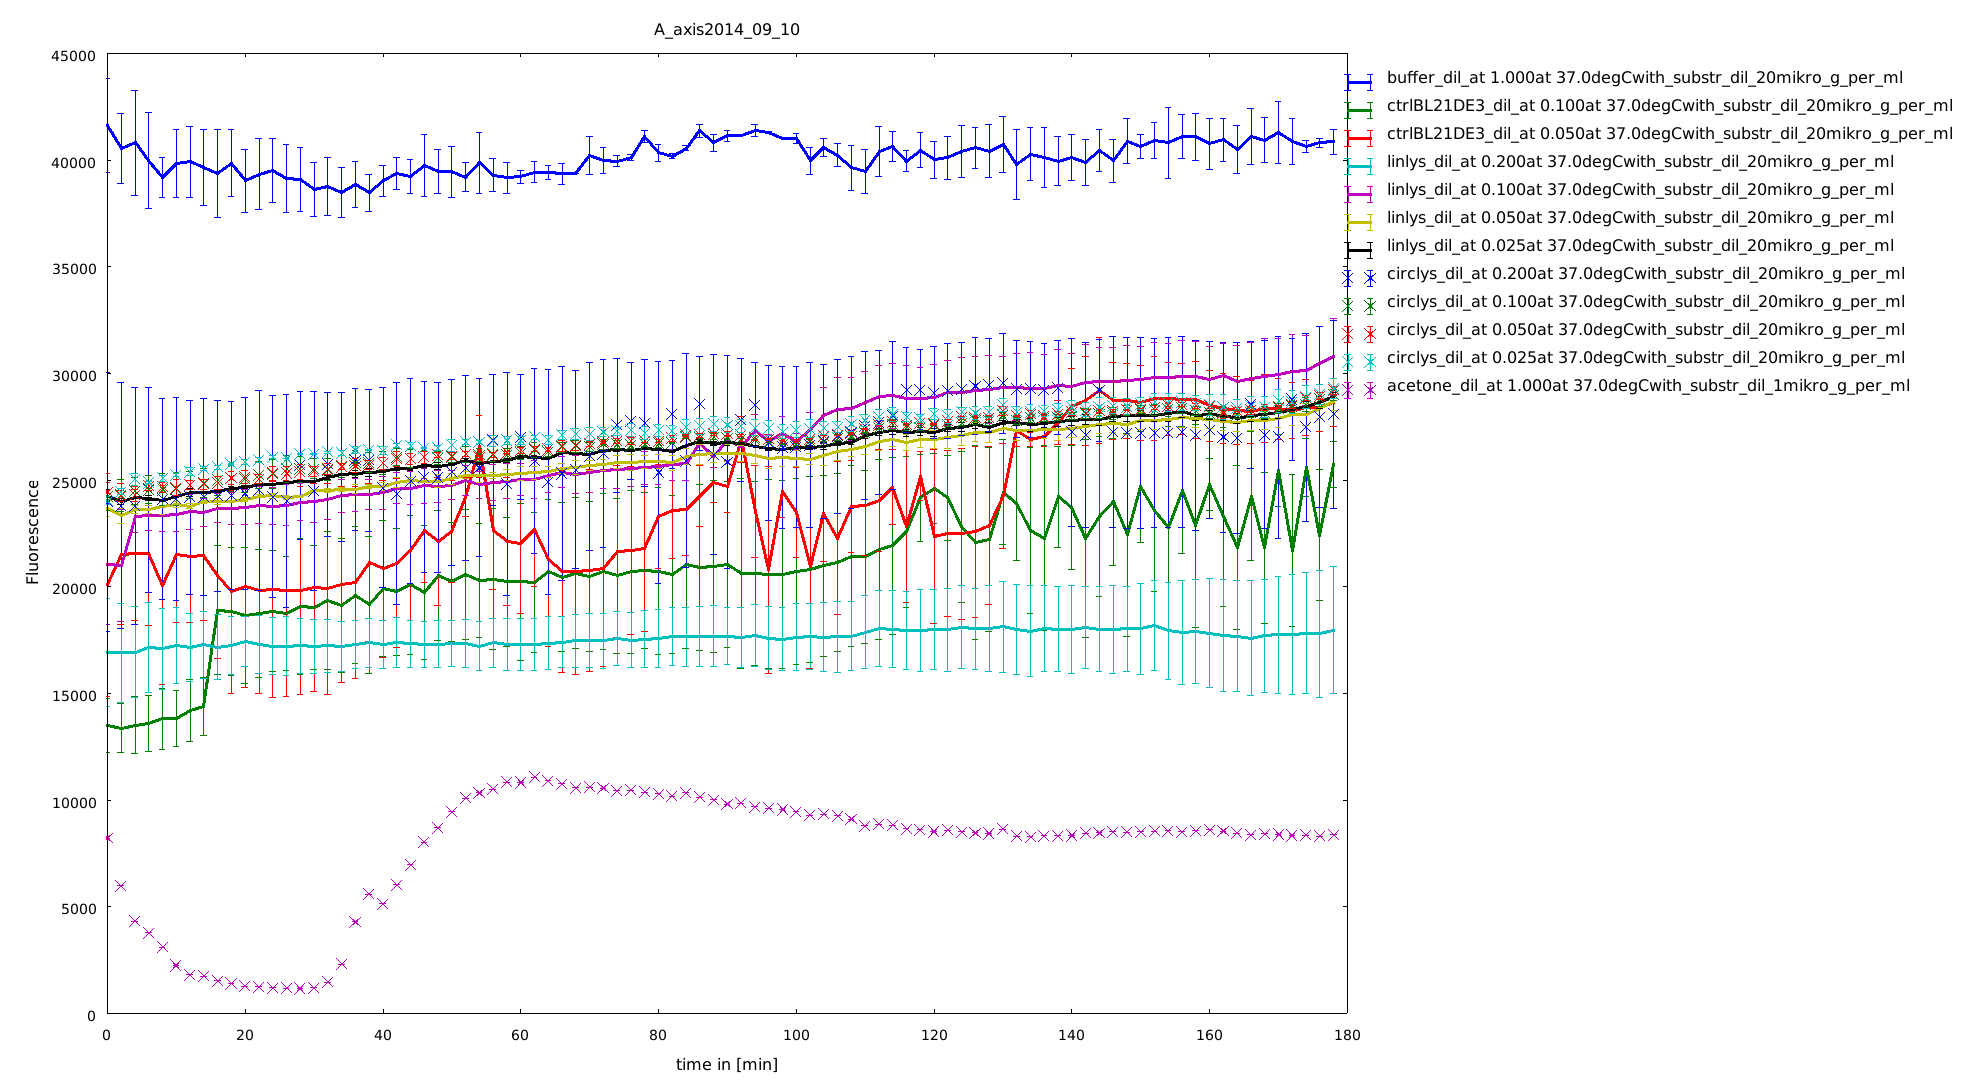
10th of September (1)
Next to the first assay we tested a second assay based on an increase of fluorescence intensity. We performed the assay with many different dilutions of substrate and of lysozymes, testing the fluorescein labeled peptidoglycane.To proof the labeling we added the supernatants of the washing steps to see whether they are still fluorescing or not. The fluorescence absolutely doesn't behave as we expected. We don't see any enlargement of the fluorescence. The different curves have huge variations between them.

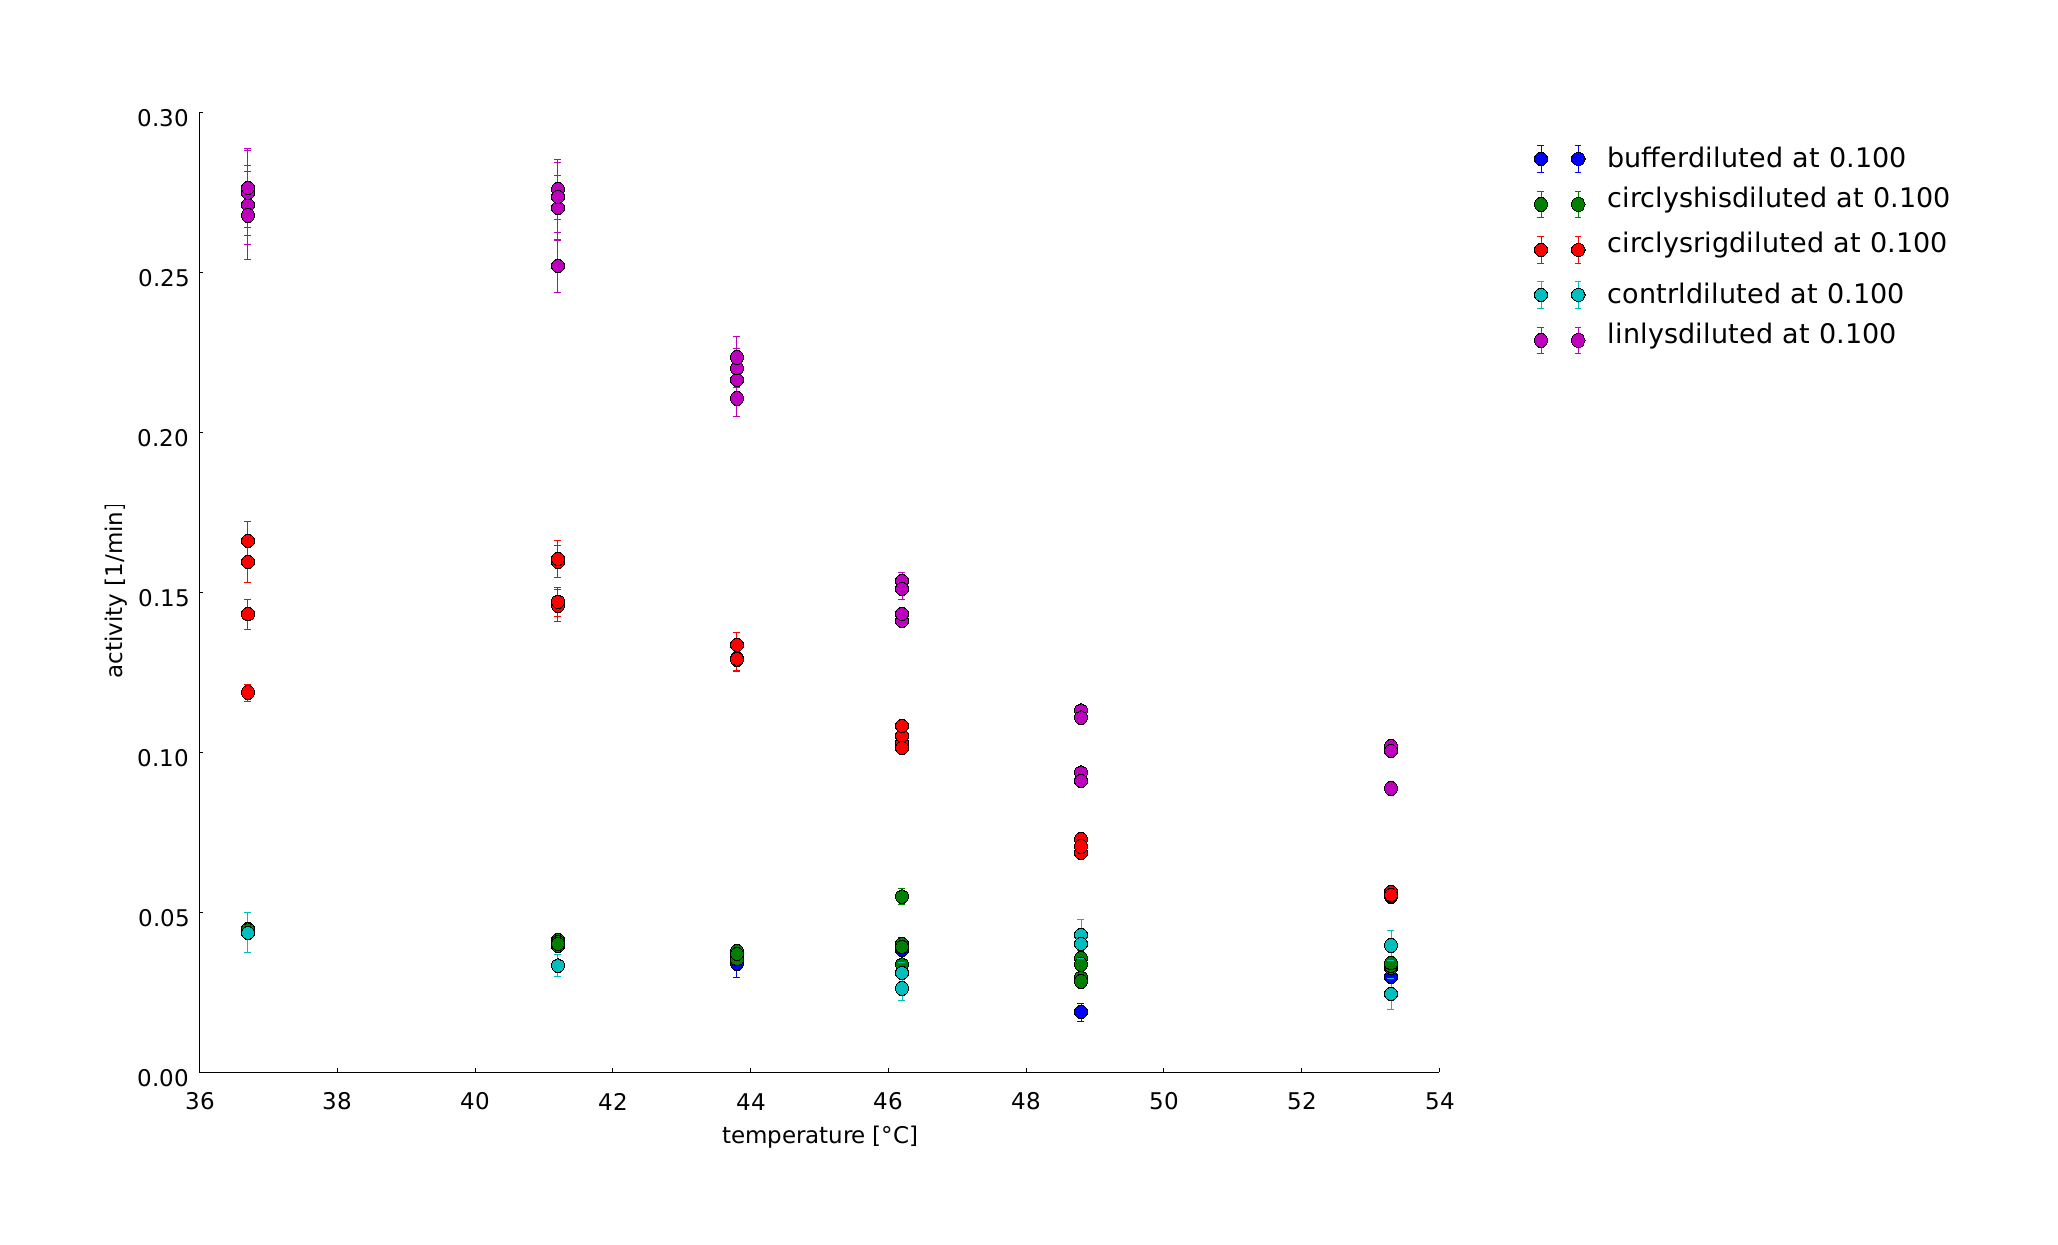
10th of September (2)
To have a higher statistical coverage we reproduced the last assays. The temperature span of the heat shock was 37°C until 54°C. From this assay on, we could test and evaluate different linkertypes properly, as we have introduced a fitting method, showing the activity of the lysozymes as the exponent of the exponential decay. As we always had different expression levels, we introduced a normalization of the activity to the activity at 37°C. There seems to exist some offset activity, the lysozymes always keep. In the plots above you can see, how important a normalization is, as the activity plots sometimes are too crowded. But on the other hand, these plots can be misleading, as they overestimate, when there is low activity already.
11th of September (1)
To have a comparison between biological replicates we repeated the last assay under the same conditions. The results are similar, our assay indeed is reproducable with different biological samples.

11th of September (2)
To find a temperature span where we can finally screen our linkers we did the last assay at higher temperatures up to 70°C.
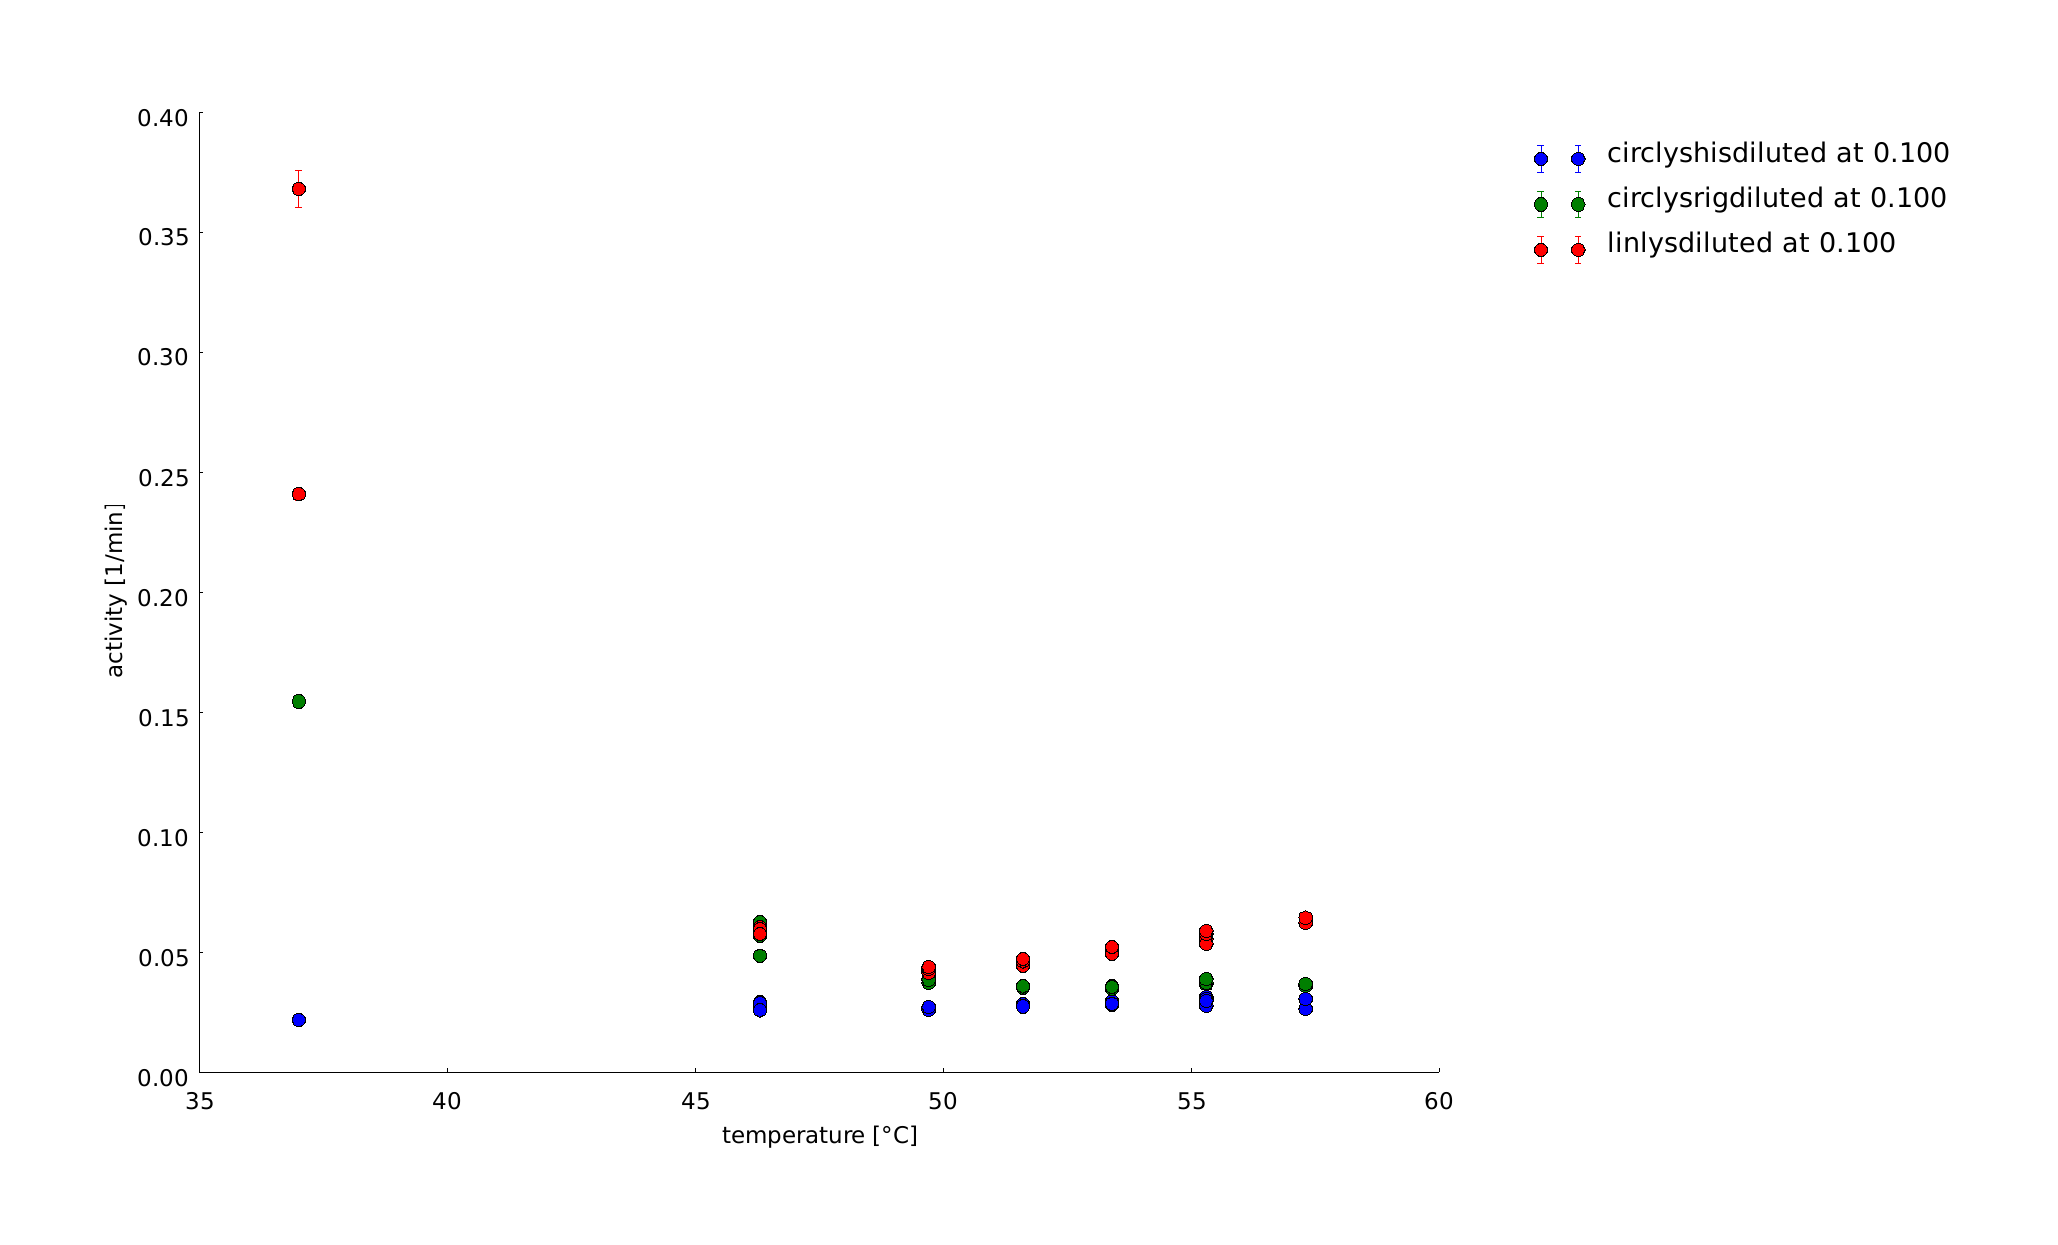
12th of September
In this assay we increased the temperature level of the heat shock, again. Aim of the last and following assays is to have data for the complete span up to 95°C. One can see, that while linear lysozyme has an activity maximum at 75°C circular lysozyme has not.
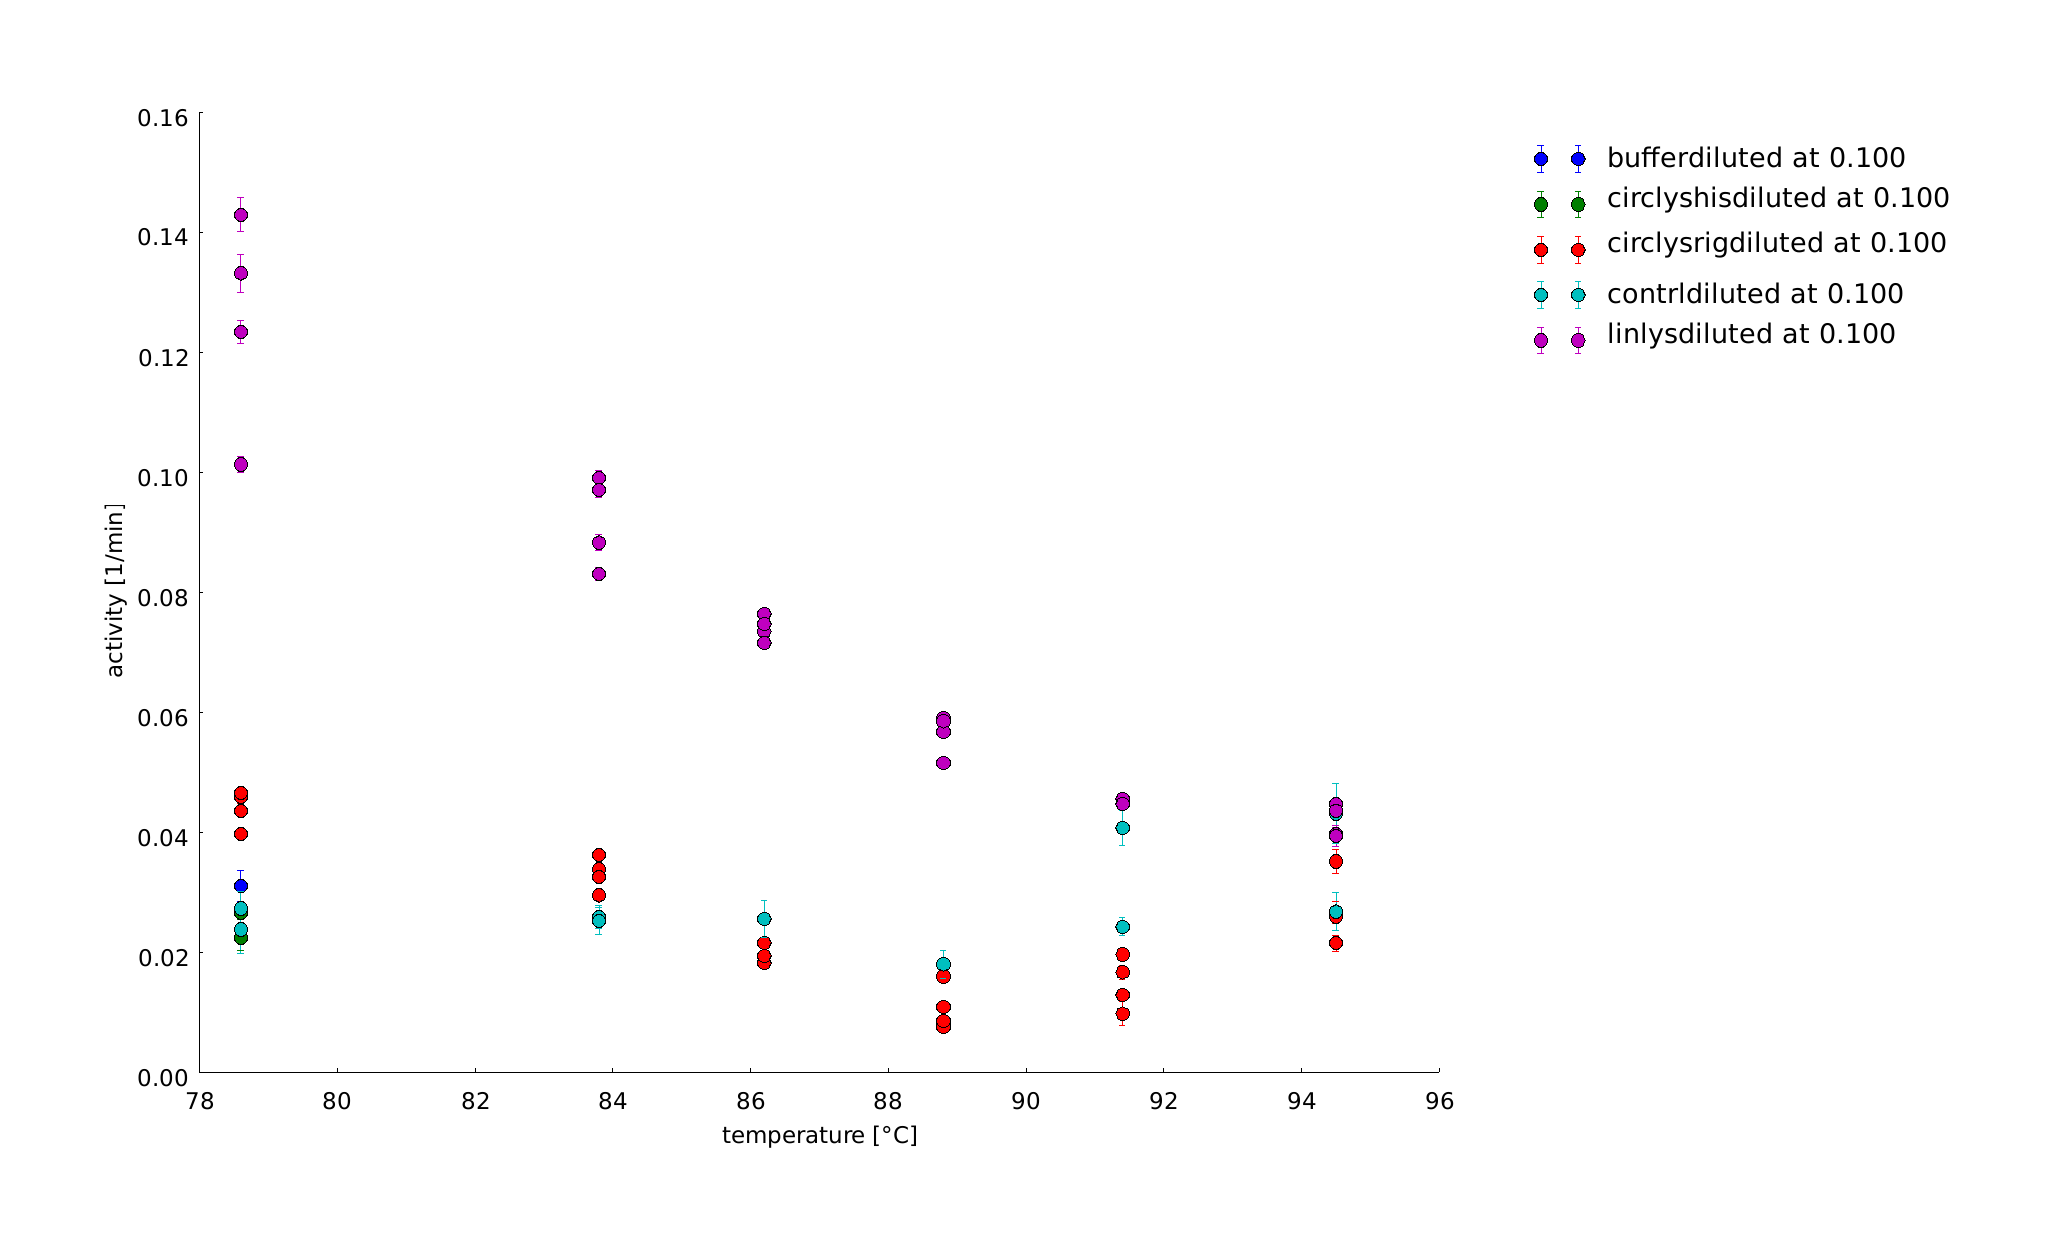
14th of September
The samples were heat shocked for half of an hour at 78°C up to 95°C. At least at a heat shock of 95°C all the samples loose activity, but somehow are always clearly distinguishable from the controls.
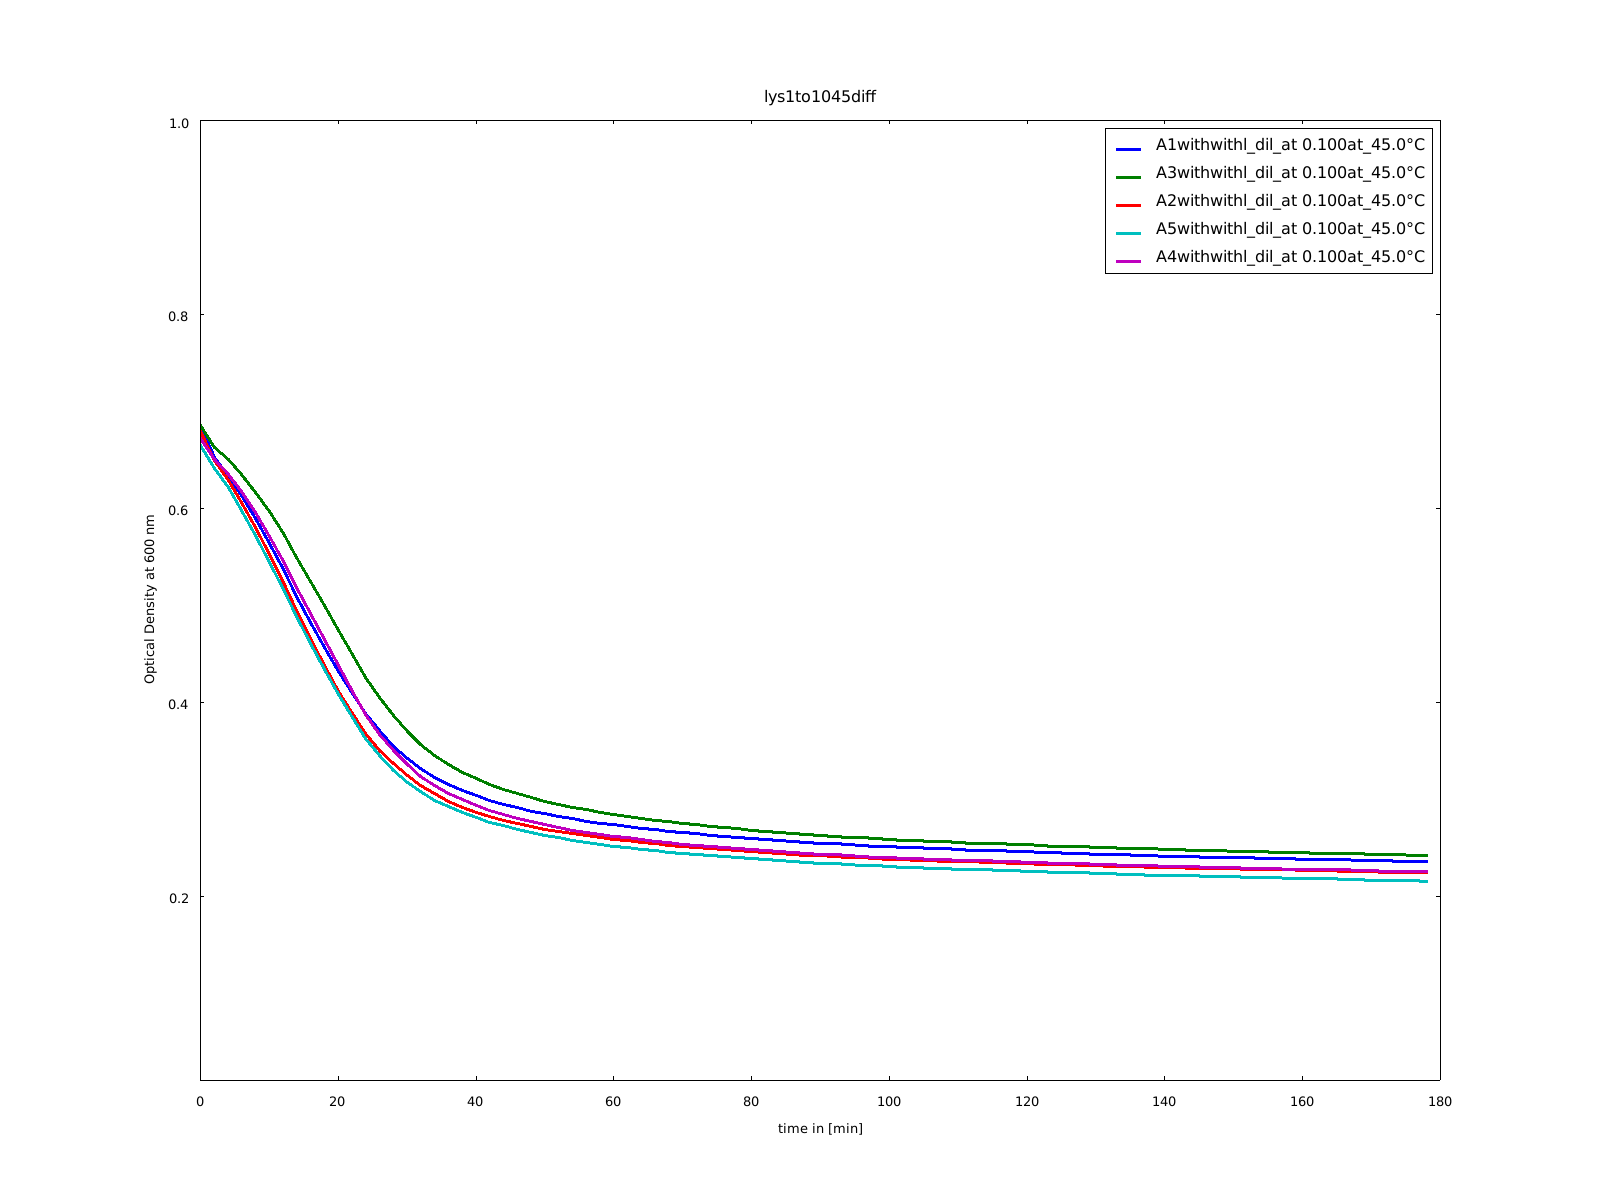
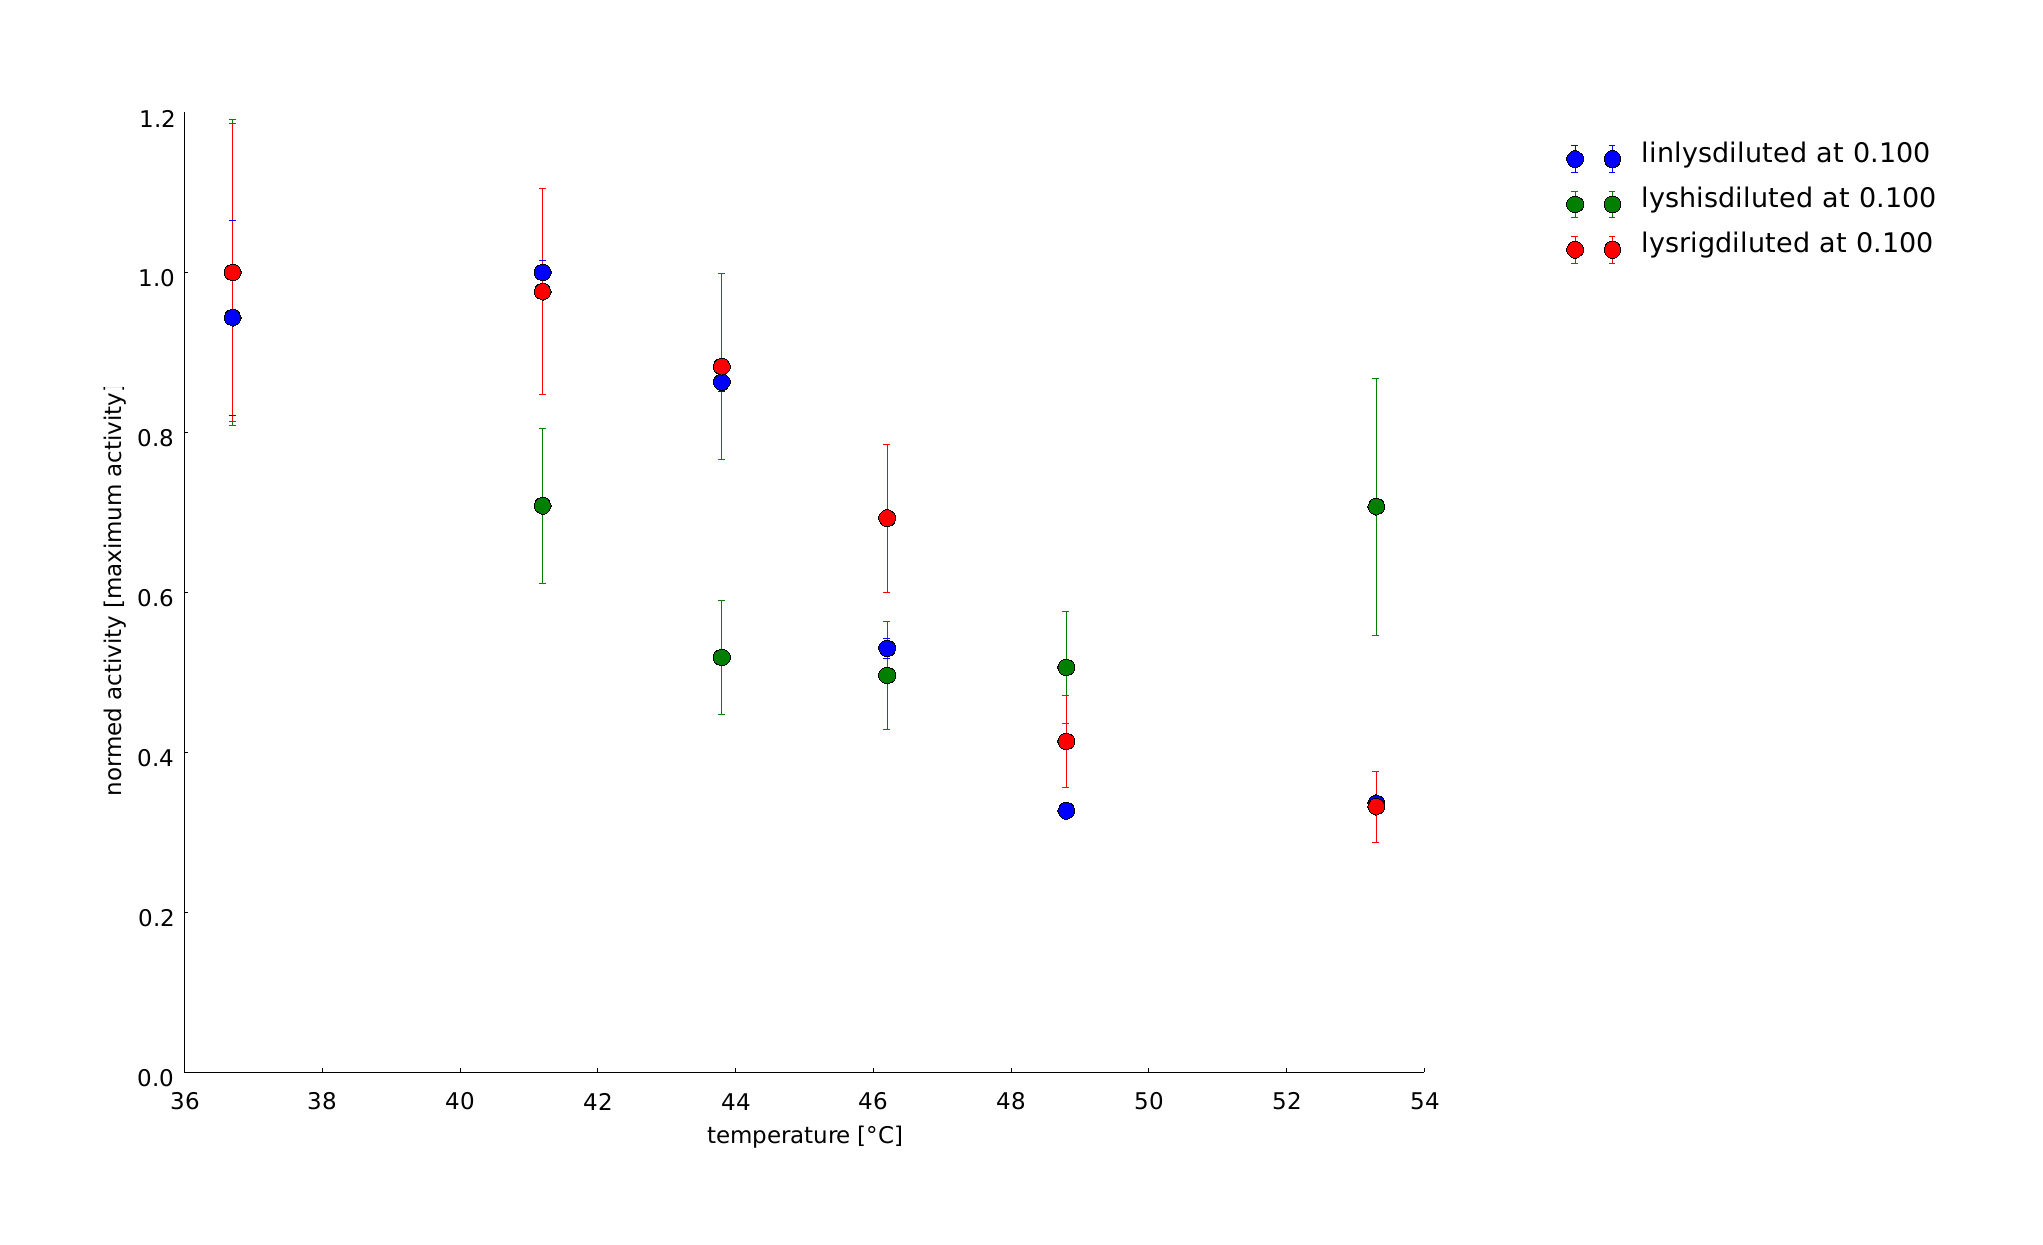
15th of September
In the last assays we recognized that the temperature span between 45°C and 55°C is interesting one for us related to a difference between the linear lysozyme and the lysozyme with the rigid linker in loosing the conformation from 37°C. So we repeated the assay in this span. There can be seen huge differences in the temperature behaviour of the different lysozymes after normalization. But it is not clear, whether they come from differences in expression level, or not.

19th of September
On this assay OD calibration was made. Also we tried to have same "standard" activity at 37°C for all constructs, so that normalization isn't that grave anymore. The OD can be calculated to M. lysodeicticus concentration in the linear range until dilution of substrate of 0.65 mg/ml with 1.160 ml/mg + 0.13. So we can extend our range to 0.66 mg/ml, so that we have more time where we can measure.
28th of September
To test the recovery of the lysozyme constructs after heat-shock we did two assays with the same heated samples. One part we let recover for 20h at 37°C. The temperature span is from 40.3°C-54 °C with a reference temperature at 37°C. The heat shock was 30 minutes. The substrate concentration was after calculation of the last assay 0.66 mg/ml. We had two aims: Is there protease activity and is there some effect of heatshock.
29th of September
This assay was made after a recovery time of the lysozyme samples of 20h. The samples recovered at 37°C over night. It was measured at 37°C in the platereader as well. This is the continuation of the test of 29th of september. The rest of the samples that could recover over night was put on a plate. We could not see any recovery from the heatshock and protease activity. The activity levels for both lysozyme constructs were nearly the same before and after the recovery time.
30th of September
We want to find the appropriate length of heat shock for our assay to see the effect of different heatshock lengths and figure out whether there is a difference between the different lysozyme constructs. The samples were heated for 1 and for 7 minutes. For such short heatshocks in the temperatures where normally the activity is lost, most of the activitiy for all of the constructs remained still. For the ridid linker activity even increased and had a maximum activity at 46 degrees. Unfortunately the errors are enormous as we only had duplicates on the wellplate. The 1 minute heatsock seems the range where we could observe differences between the different linkers.

1st of October
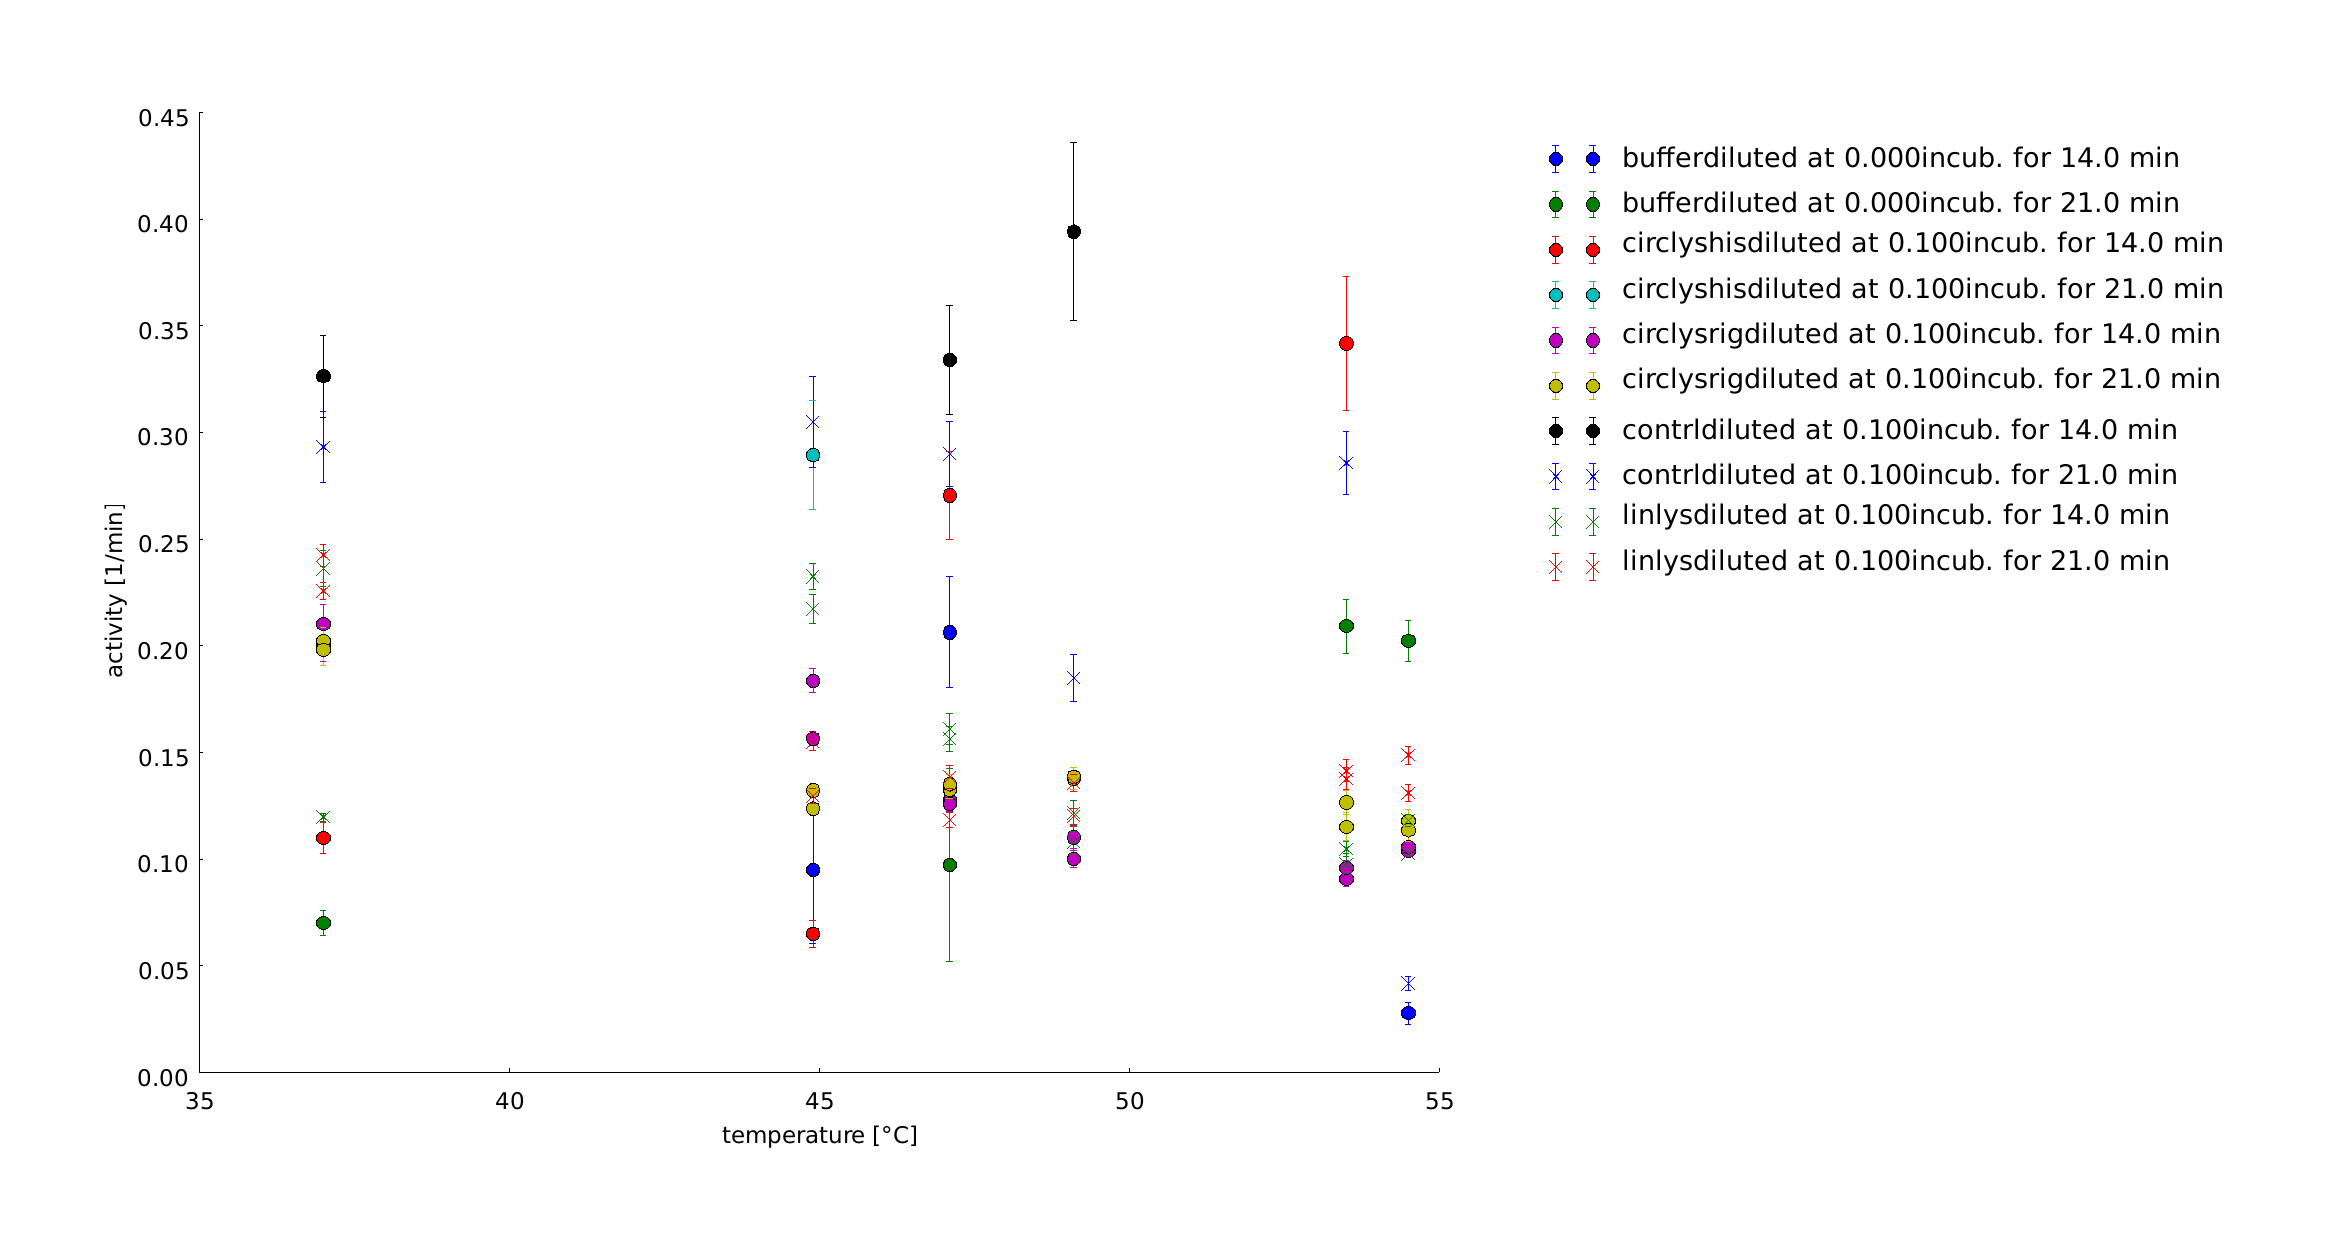
The samples were heated for 14 and for 21 minutes. With this longer heatshocks we observe the same behaviour as with the 30 minutes, so no clear tendencies can be seen. So we decided to perform all following assays of the linker screening with a heat shock time of 1 minute. The last preperations to set up the final assay were finished.
4th of October
The final protocol you can find in in Materials and Methods or in parts of the text above!
References
[1] Callewaert, L. & Michiels, C. W. Lysozymes in the animal kingdom. J. Biosci. 35, 127–160 (2010).
[2] Evrard, C., Fastrez, J. & Declercq, J. P. Crystal structure of the lysozyme from bacteriophage lambda and its relationship with V and C-type lysozymes. J. Mol. Biol. 276, 151–64 (1998).
[3] Iwai, H., Lingel, a & Pluckthun, a. Cyclic green fluorescent protein produced in vivo using an artificially split PI-PfuI intein from Pyrococcus furiosus. J. Biol. Chem. 276, 16548–54 (2001).
[4] Callewaert, L. et al. Purification of Ivy, a lysozyme inhibitor from Escherichia coli, and characterisation of its specificity for various lysozymes. Enzyme Microb. Technol. 37, 205–211 (2005).
[5] May, R. Turbidimetric Determination of Lysozyme with Micrococcus Cells : Reexamination of Reaction Conditions. 85, 77–85 (1983).
[6] Maeda, H. A New Lysozyme Assay Based on Fluorescence Polarization or Fluorescence Intensity Utilizing a Fluorescent Peptidoglycan Substrate 1. 1191, 1185–1191 (1980).
[7] Du, K., Porsch, P., Mahn, A., Brinkmann, O. & Gie, W. The non-enzymatic microbicidal activity of lysozymes. 449, 93–100 (1999).