 "
"
Team:BIOSINT Mexico/Results


Results
Red Light Switch
We fused the promoter PCMV (BBa_K747096) to a YFP reporter (BBa_E0030).
In order to measure its expression, we culture transformed E.coli in agar plates and measured the fluorescense intensity every 45 minutes. After that, we obtained the following data. [Fig.1]
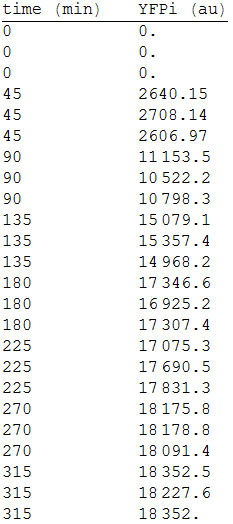 Figure 1 YFP intensity every 45 minutes.

We made three repetitions, so in order to model the equation, we obtained the mean measure, therefore:
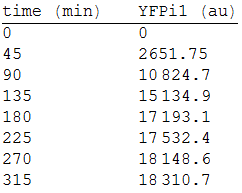 Figure 2 Media YFP intensity every 45 minutes.

We analysed the data and using the Wolfram Mathematica software, we obtained the following equation that fits the data.
If we plot this equation, we obtain:

Where we can see that the intensity of YFP grows directly proportional to the time and concentration of the molecule.

Mer Operon Expression
In order to measure the mer operon expression fused the composite to a GFP reporter and analized the bioremediation by measuring the change of the concentration of methyl mercury in the media. First, we measured the GFP fluorescense intensity every 45 minutes.
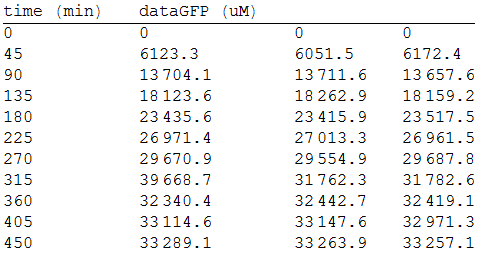 Figure 4 GFP fluorescense intensity every 45 minutes.

As we make three repetitions, we take the mean values as input data for the regression. The analized data was:
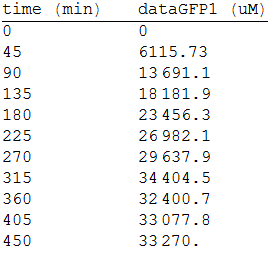 Figure 5 GFP fluorescense media intensity every 45 minutes.

For the regression, we used the Wolfram Mathematica software and obtained the equation:

Thus, if we plot the equation we obtain that:
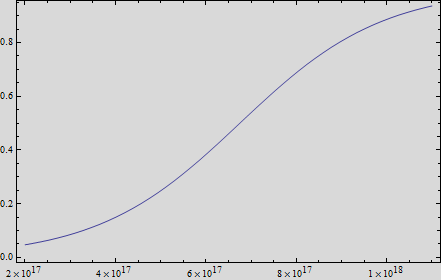 Figure 6 Graphic GFP fluorescense media intensity vs time.

And, as we see in the graph, GFP expresses directly proportional to time, given the strenght of the promoter upstream. Then, as GFP expresses at aproximately the same rate that the mer operon proteins, it is posible to infer that the GFP concentration given any time is the same as the mer operon proteins concentration attached upstream. The change in the concentration of methyl mercury was also measured. We choose to measure it instead of the mercury accumulated inside the cells because it was easier. The collected data is provided in the table:
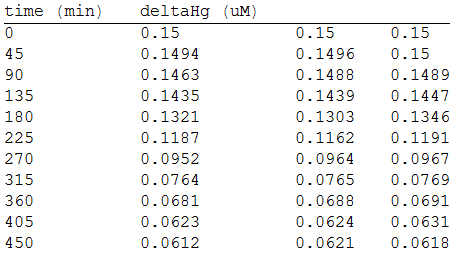 Figure 7 Concentration of methyl mercury inside cell every 45 minutes.

As in the other experiments, we analyzed the mean values of the concentration in order to make the regression:
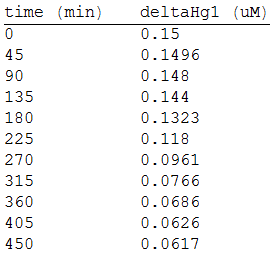 Figure 8 Media concentration of methyl mercury inside cell every 45 minutes.

Obtaining the polynomial equation:
And, if we plot the equation we obtain the following graph:
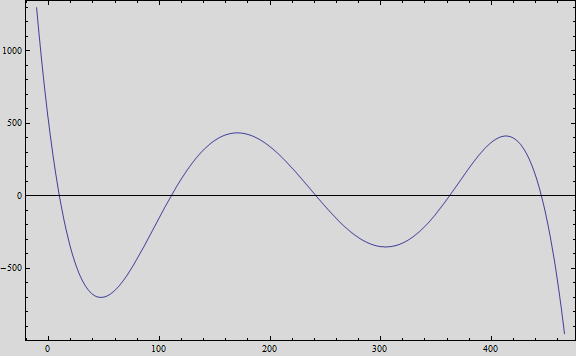 Figure 9 Graphic of concentration methyl mercury inside cell.

That, at short term, fits the behavior of the expected values.